3.1 DNA methylation
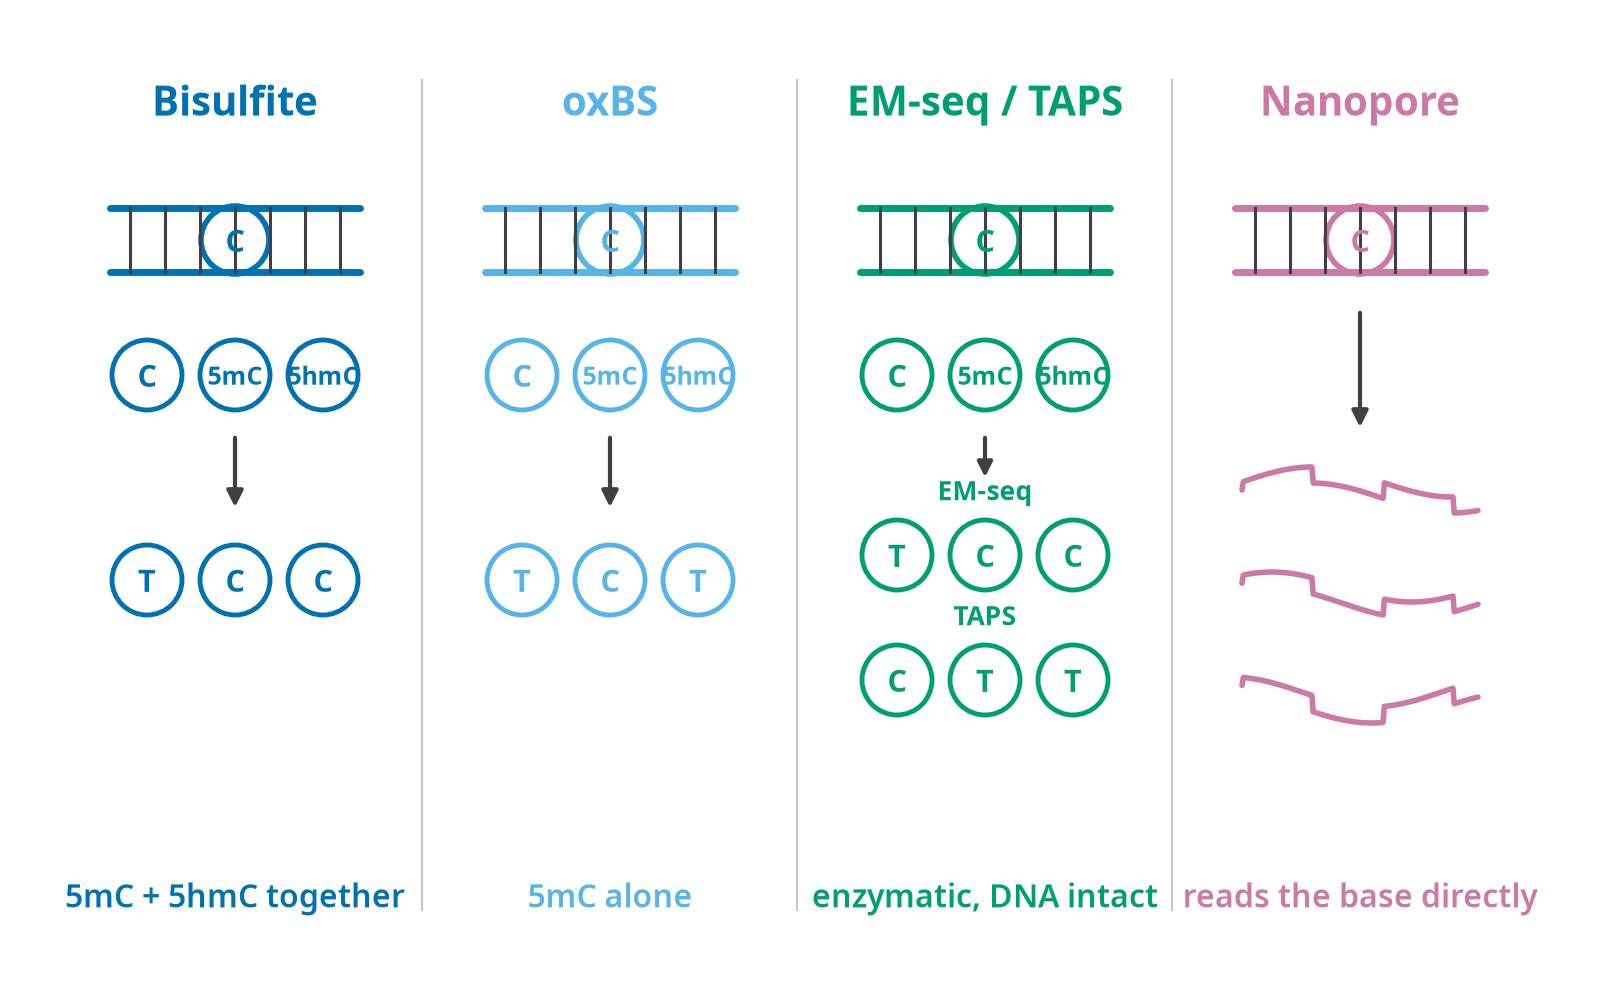
The four columns answer the same question differently, and the differences are what a clock’s coefficients were fitted through. Bisulfite protects 5mC and 5hmC alike, so a bisulfite beta is their sum and every array clock is trained on that sum. Oxidative bisulfite converts 5hmC to a form that then reads as T, which isolates 5mC. EM-seq and TAPS are both enzymatic and both leave the DNA intact, but they are inverses of each other at the readout: EM-seq reads a methylated cytosine as C, TAPS reads it as T. Nanopore skips conversion and calls the base from the current trace. A coefficient fitted on a bisulfite array does not transfer to a TAPS library without accounting for that.
Chemistry. 5-methylcytosine at CpG dinucleotides. In mammals 70–80% of CpG cytosines are methylated. Bisulfite treatment deaminates unmethylated cytosine to uracil (read as thymine) and leaves 5mC intact, creating a C/T polymorphism that every downstream assay queries. Enzymatic conversion (EM-seq, TAPS) is the low-damage alternative and is displacing bisulfite for sequencing.
Beta value. For a CpG, β = M / (M + U + α) where M and U are methylated and unmethylated intensities and α is a stabilising offset (Illumina default 100). β ∈ [0,1]. Nearly every clock consumes β. The M-value M = log2(β / (1 − β)) is preferred for differential testing because it is homoscedastic, but clock coefficients are almost always in β space, do not silently swap.
Array platforms.
| Illumina 27K (HumanMethylation27) |
27,578 |
Horvath 2013 and Bocklandt-era clocks |
| Illumina 450K |
485,512 |
The workhorse; most published coefficient sets |
| EPIC v1 (850K) |
865,918 (manifest B4) |
Keeps over 90% of 450K probes; adds about 413,000 CpGs, many in enhancers |
| EPIC v2 |
937,690 probes / 923,452 unique sites |
Probe IDs carry suffixes (cg00000029_TC21); replicate probes must be aggregated before applying any clock |
| Illumina MSA (Methylation Screening Array) |
~270K |
Targeted, cheaper; emerging |
| HorvathMammalMethylChip40 |
~37K conserved loci |
128+ mammalian species, 59 tissues; basis of the universal mammalian clocks |
| HorvathMammalMethylChip320 |
expanded |
Used by EnsembleAge |
Probe chemistry inside the array. Infinium Type I uses two beads per CpG (one for the methylated allele, one for unmethylated) in a single colour channel; Type II uses one bead with two-colour single-base extension. Type II is ~85% of probes on EPIC and has a compressed dynamic range and different beta distribution. This design bias is what BMIQ corrects.
Sequencing assays. - RRBS - MspI digestion enriches CpG-dense regions; sparse, integer-count coverage. Petkovich (90 CpGs, mouse blood), Stubbs (multi-tissue mouse), Meer, Thompson all use RRBS. - WGBS - full coverage, expensive; the substrate for scAge/scEpiAge single-cell work. - Targeted bisulfite sequencing - HepatoXu (10 loci, plasma cfDNA HCC detection). - scM&T-seq / snmC-seq - single-cell methylation, binary and extremely sparse (often <10% of CpGs covered per cell), forcing entirely different algorithms.
Normalisation pipeline (array). IDAT → background correction and dye bias (noob) → between-array (funnorm, quantile, or SeSAMe) → probe-type bias (BMIQ or SWAN) → detection-p filtering, cross-reactive/SNP probe masking, sex-chromosome handling. Consensus from Illumina EPIC comparisons: noob + BMIQ and SeSAMe perform well; funnorm is preferred when global methylation differences are expected between groups. sesame_450k_median.csv in ComputAge is the field’s standard NA-fill vector (ComputAge clocks dir).
Cell composition. Whole blood is a mixture; a clock trained on bulk blood partly reads cell proportion. Two standard reference libraries: Reinius/Houseman 6-cell (450K, 450K_reinius_12_reference.csv) and Salas/IDOL 12-cell EPIC (EPIC_salas_18_reference.csv). Deconvolution is a constrained regression onto a reference signature matrix; pyaging exposes 6-cell and 12-cell EPIC deconvolution as clocks in their own right, returning proportions.
Sex estimation from methylation. X and Y chromosome probe z-scores against the autosomal mean and SD, projected on PCA loadings, implemented as XChrom (4,047 probes) and YChrom (284 probes) in pyaging e7267e9, classes XChrom and YChrom in _models.py. Needed because GrimAge, DNAmFitAge and the mammalian clocks take sex as an input.
3.5 Clinical chemistry and haematology
The PhenoAge / KDM / HD family. Canonical nine PhenoAge markers plus age:
| Albumin |
g/L |
g/dL |
| Creatinine |
µmol/L |
mg/dL |
| Glucose |
mmol/L |
mg/dL |
| C-reactive protein |
ln(mg/dL) |
ln(mg/L) |
| Lymphocyte percent |
% |
|
| Mean cell volume |
fL |
|
| Red cell distribution width |
% |
|
| Alkaline phosphatase |
U/L |
|
| White blood cell count |
10³ cells/µL |
|
Unit mismatch is the number-one source of wrong PhenoAge values in the wild, see §16.
The BioAge R package extends this to a larger marker menu with clinically-healthy windows used to build the HD reference cohort (BioAge hd_nhanes.R): albumin, ALP, ln(CRP) with CRP < 2, total cholesterol < 200, ln(creatinine), HbA1c 4–5.6, SBP < 120, DBP < 80, mean BP < 93.33, BUN, uric acid (sex-specific 2.7–6.3 F / 3.7–8.0 M), lymphocyte % 20–40, MCV, WBC 4.5–11, RBC (sex-specific), RDW 11.5–14.5, monocytes 3–10, neutrophils 45–74, cystatin C 0.51–0.98, GGT (sex-specific), insulin 2.52–24.1, HDL (sex-specific), LDL 80–130, triglycerides 54–110, pulse 60–100, FEV1 ≥ 0.8 × mean, cadmium 2.7–10.7, vitamins A/E/B12/C.