
cyRAVEN turns a folder of FCS files into population frequencies, marker expression, a UMAP and group statistics. This page explains what happens to the data at each stage, and why it is done that way.
New to flow cytometry? Read About flow cytometry first. Want to run something now? Go to Get started.
Why per-sample gates
Manual gating varies between operators. When 38 operators gated the same files, the median expanded uncertainty was 3.6%, and experience made no significant difference (Grant and others, 2021, PDA J Pharm Sci Technol 75:33). Across 320 clinical samples analysed by six technologists on three harmonised cytometers, the remaining spread followed the operator more than the instrument (Mead and others, 2026, Cytometry B, doi:10.1002/cyto.b.70048).
Copying one set of gate coordinates to every sample does not solve this. Staining intensity differs between samples, so a fixed cut is right for some and wrong for others, and the error then follows staining intensity. cyRAVEN places each cut inside its own sample and reports how precisely that cut is determined.
Statistics follow one rule: the sample is the unit, not the
cell. A tube run for longer gives more events but no more
information about the study, so every test first reduces each sample to
one value. Several samples from one donor are not independent either;
--paired-column and --condition-column pair
them. Anything that cannot be reduced to one value per sample is
reported as an effect size without a p-value.
Two ways to use it
| Declared (default) |
Explore (--explore) |
|
|---|---|---|
| You supply | A list of populations and their marker rules | Only the FCS files |
| You get | Named populations, with uncertainty and statistics | Numbered clusters over every usable channel |
| It can find | Only what you listed | Populations nobody listed |
| Cells used | The CD45+ parent gate | Every event, after its own debris and dead-cell screen |
Explore writes to <outdir>/explore/ and changes
nothing else, so adding it to a run is safe. --explore-only
needs no population list at all. The two halves share nothing unless you
add --maybe-learn; see Explore
mode.
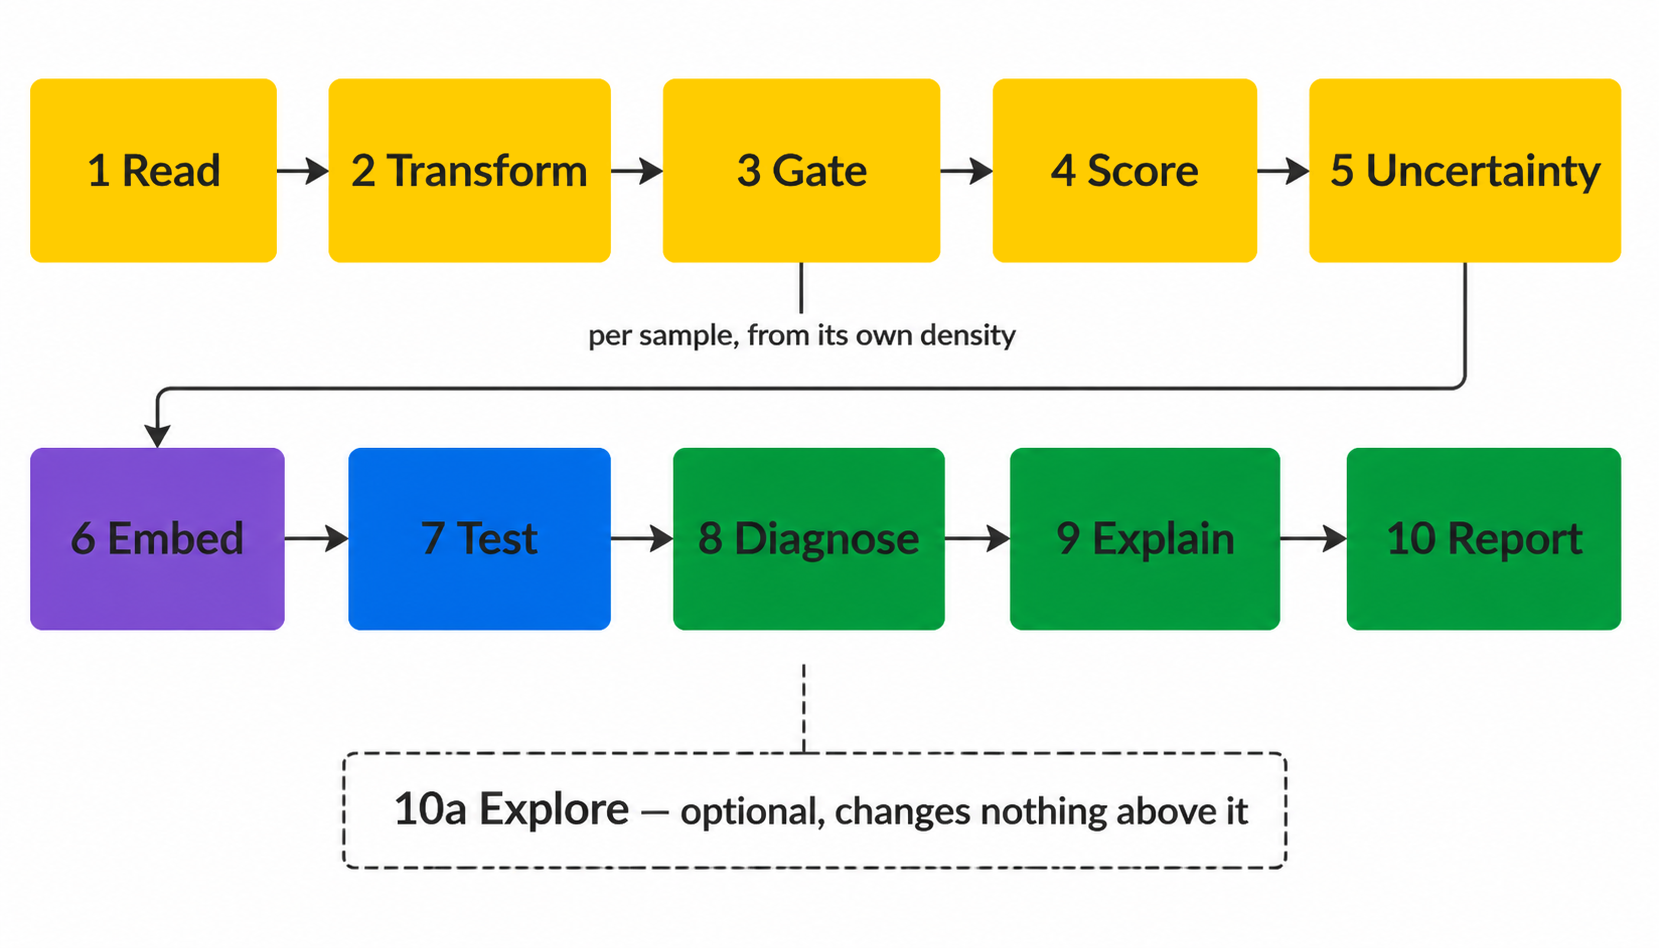
How it works: the ten stages
One call to run_cyraven() runs every stage. Each stage
is also an exported function, so you can run or replace a single
step.
| Stage | In plain words | Function |
|---|---|---|
| 1 Read | Open each file and work out which channel is which marker | read_fcs_resolved() |
| 2 Transform | Put intensities on an arcsinh scale, which spreads the dim end and compresses the bright end | derive_cofactor() |
| 3 Gate | In each sample, cut each marker at the lowest point between its negative and positive peaks |
density_valley(), resolve_threshold()
|
| 4 Score | Count the cells that meet each population’s rule from your YAML | score_populations() |
| 5 Uncertainty | Re-derive every cut on resampled events to see how far it moves | threshold_uncertainty() |
| 6 Embed | Build a UMAP with about the same number of cells from each sample | run_umap() |
| 7 Test | Compare groups with one value per sample | stats_group_comparison() |
| 8 Diagnose | Check whether the gates and populations held up |
stats_threshold_drift(),
cluster_gate_agreement()
|
| 9 Explain | Describe an unexplained cluster as a gating strategy | explain_cluster() |
| 10 Report | Write tables, figures, the run manifest and
report.html
|
write_run_manifest() |
The sections below give the detail for each stage.
1 Read
read_fcs_resolved() resolves channels to marker symbols
from $PnS with fallback to $PnN, and applies
the acquisition spillover matrix where the file carries one. Spectral
instruments write unmixed data with no matrix, so
maybe_compensate() detects and reports rather than
assuming; applying compensation twice is as damaging as omitting it.
2 Transform
set.seed(42)
mk <- c("CD3", "CD4", "CD8", "CD19")
ex <- matrix(abs(rnorm(20000 * 4, 0, 250)),
             ncol = 4,
             dimnames = list(NULL, mk))
cf <- derive_cofactor(
  ex, setNames(1:4, colnames(ex)))
round(as.numeric(cf), 1)
#> [1] 157.2The arcsinh cofactor governs the width of the quasi-linear region
near zero. The conventional value of 5 derives from mass cytometry and
over-expands the background band on spectrally unmixed fluorescence
data. Each marker is bisected until the interquartile range of its
background distribution reaches a target, and the panel adopts the
median. derive_cofactor_pooled() estimates across samples
so that a single weakly stained file does not set the scale on which
every threshold in the run is computed.
3 Gate
# a bimodal marker
x <- c(rnorm(8000, 0, 0.4),
       rnorm(2000, 4, 0.5))
round(density_valley(x), 2)
#> [1] 1.52Thresholds are placed at the density minimum within each sample.
density_valley() returns NA for unimodal
distributions, after which resolve_threshold() uses a
declared control if there is one, otherwise a tail gate above the
dominant mode, and only then a flagged quantile. Derivation is recorded
per threshold in thresholds_used.csv.
Per-sample thresholding accommodates staining variation but permits
the definition of a population to differ between groups, which
stats_threshold_drift() exists to detect.
4 Score
spec <- default_population_spec()
str(spec[["CD3 pos CD4 pos"]])
#> List of 2
#> $ CD3: chr "above"
#> $ CD4: chr "above"Populations are evaluated as Boolean conjunctions of marker directions read from YAML. Editing the specification changes the analysis without modifying R code.
5 Quantify the uncertainty
u <- threshold_uncertainty(
  x_parent, source = "valley", B = 100)
c(u$u_sampling, u$u_method, u$u_combined)
Each cut is re-derived from resamples of its own events, and again across the settings that placed it. The two spreads combine in quadrature and propagate to every population reading that marker, alongside the CD45 parent term, which enters all of them because it fixes the denominator.
The reported threshold is unchanged: the perturbation runs on copies.
Every entry point saves and restores .Random.seed, so the
cell selection in the next stage draws from the same stream position
whether this runs or not.
6 Embed
emb <- run_umap(mat, n_neighbors = 30,
                min_dist = 0.3, seed = 42)
select_umap_features() excludes scatter, viability, time
and the height and width duplicates of area channels; retaining these
was the principal cause of uninformative embeddings in the precursor
implementation. plan_subsample() draws equal cell numbers
per sample so that acquisition depth does not determine the
manifold.
ret_model = TRUE retains the model for projection of
later batches through project_umap(), which holds
coordinates fixed between runs. Model retention alters the embedding;
see ?run_umap.
7 Test
ids <- sprintf("S%02d", 1:12)
freq <- data.frame(
  sample_id = rep(ids, each = 2),
  population = rep(c("CD4 T cells",
                     "B cells"), 12),
  pct_of_cd45_pos = c(rbind(
    rnorm(12, 25, 4), rnorm(12, 10, 2))),
  is_control = FALSE, qc_status = "pass")
grp <- setNames(
  rep(c("HC", "Patient"), each = 6),
  ids)

res <- stats_group_comparison(
  freq, grp, reference = "HC")
res[, c("population", "comparison_group",
        "n_reference", "cliffs_delta",
        "p_value")]
#> population comparison_group n_reference
#> 2 CD4 T cells Patient 6
#> 1 B cells Patient 6
#> cliffs_delta p_value
#> 2 -0.167 0.6991342
#> 1 0.000 1.0000000stats_marker_state() applies the same treatment to
marker expression within a population, testing median intensity and
percent positive separately because a shift confined to a subset moves
one and not the other.
8 Diagnose
Six outputs constrain interpretation of the preceding stages: threshold drift, gate and counting uncertainty, phenotype concordance, gate against cluster concordance, learned gate geometry, and conformance against a baseline. The Diagnostics covers each in full.
batch_mixing_report() quantifies batch structure in the
embedding against a permutation null and reports Cramér’s V
between batch and group. Correction through --correct-batch
is refused above a configurable V, where batch and biological
effect are not separable.
stats_threshold_drift() tests whether marker thresholds
separate by group, which would render an abundance difference partly
definitional.
stats_confounding() reports whether a covariate both
differs across groups and associates with the outcome within groups, the
two conditions jointly defining a confounder.
cluster_gate_agreement() cross-tabulates declared labels
against unsupervised clusters, which can reveal a population absent from
the specification, or a threshold rejecting events that belong to its
population.
run_gate_uncertainty() reports how far each threshold
moves under resampling and propagates that to every population reading
it, so a difference smaller than its own gate’s movement is identifiable
as such.
9 Explain
cluster_gate_agreement() identifies a cluster matching
no declared population but cannot characterise it, leaving a cluster
index and a cell count.
explain_cluster() inverts the gating stage. Given
labelled events it selects the two most discriminating markers, fits a
convex polygon in that plane, retains the enclosed events and recurses,
producing the topology of a manual gating strategy.
st <- explain_cluster(marker_matrix,
                      cluster_id == 7)
# marker pair and metrics per level
st$summary
# vertices, on the analysis scale (arcsinh or logicle)
st$levels[[1]]$polygon
Convex polygons rather than thresholds: a conjunction of
one-dimensional cuts is an axis-aligned rectangle, and an oblique
boundary constrained to a rectangle must admit contaminants or exclude
genuine events. derive_singlet_band() is a hand-written
instance of the same geometry.
Metrics are computed on held-out events with the resubstitution value alongside, since eight free half-planes can memorise a few thousand events. The stage is descriptive: it carries no p-value and scored frequencies are identical whether it runs or not.
--external-labels supplies the labels from elsewhere, a
cyCONDOR clustering for instance, and
gate_transferability() then refits the strategy with one
donor withheld and scores it on that donor. Held-out events come from
the same donors and overstate how well a gate travels; the per-donor
minimum does not. --export-gates writes the result as
Gating-ML 2.0 on the scale it was fitted on, and as a vertex table in
the units the FCS file stores.
10 Report
Figures, tables, and write_run_manifest(), which records
R version, package versions, git commit and working-tree state, the full
invocation, and every input file with size and modification time. The
manifest is written before the expensive stages and rewritten at
completion, so an interrupted run records
status: failed.
10a Explore
--explore runs a second, independent analysis over the
single cells of every file (scatter and singlet gates only) and every
eligible channel, writing to <outdir>/explore/ and
leaving stages 1 to 10 untouched. It has its own quality gate, its own
embedding and clustering, and its own self-contained report.
--explore-only runs it without stages 2 to 10 at all. See
Explore
mode.
Further reading
- Running cyRAVEN, for every command and option.
- Inputs, for the sample sheet and the config.
- Gating, for threshold derivation and specification syntax.
- Diagnostics, for the outputs that falsify a specification.
- Statistics, for test selection and its assumptions.
Why explore mode is built this way
The design record for explore mode: what the supervised and unsupervised halves can lend each other, which of those exchanges are implemented, which are refused, and where that leaves cyRAVEN against the tools it sits beside.
Written because “add unsupervised clustering” is the easy half of the problem. The hard half is deciding what the two halves are allowed to tell each other without losing what made each one useful.
1. The two failure modes
Supervised and unsupervised cytometry analysis fail in opposite directions, and neither can detect its own failure.
Supervised analysis cannot find what it was not told to look for. You declare twelve populations, it scores twelve populations. A thirteenth cell type sits in the data unremarked. Worse, a declared label may cover two distinct phenotypes, and their total can stay flat while one rises and the other falls. That is a real pattern that no amount of testing on the declared table can surface, because the table has one column where the biology has two.
Unsupervised analysis cannot tell you what it found. FlowSOM returns cluster 17. Whether cluster 17 is a B cell subset, a doublet artefact, or the same cells as cluster 4 under a different sampling seed is left to a human squinting at a heatmap. And because the clusters are defined on the data, the number of them that reach significance moves with parameters nobody reports. Measured elsewhere in this project, one cyCONDOR run went from 1 significant cluster to 8 by changing only how many cells were drawn.
Running both and reading them side by side does not fix either. What fixes them is deciding which specific facts may cross between them.
2. The exchange, enumerated
Every transfer that is technically possible between the two halves, with the verdict on each.
2.1 Declared -> explore
| What could be lent | Verdict | Why |
|---|---|---|
| The transform and its estimated cofactor | Always | A property of the panel derived from the data, not a product of the declaration. An unsupervised tool assumes a transform; cyRAVEN estimates one. Lending it costs nothing and removes an arbitrary constant |
| Per-sample thresholds | Under --maybe-learn |
The single largest gain. See section 3 |
| Staining QC verdicts | Under --maybe-learn, as a column |
Recorded, never used to exclude. See section 4 |
| Batch/group confounding verdict | Under --maybe-learn |
Without it explore reintroduces the exact failure the declared path refuses. See section 5 |
| Group labels | Always | They come from the sample sheet, not from the analysis. Withholding them would mean explore could not test anything |
| The parent gate | Never | Explore exists to look outside it. Applying it would make explore a re-clustering of the declared result |
| The population definitions | Never | That is the thing being checked |
2.2 Explore -> declared
| What could be lent | Verdict | Why |
|---|---|---|
| Populations spanning several clusters |
Under --maybe-learn, as
spec_gaps.csv
|
The finding the declared path structurally cannot make about itself |
| Clusters no population covers |
Under --maybe-learn, same file |
Names what the specification missed |
| Cluster-derived population definitions, adopted automatically | Never | Circular. See section 6 |
| Re-gating, re-thresholding, or altering any declared frequency | Never | A run whose numbers were changed by a clustering is no longer the run its manifest describes |
The asymmetry is deliberate. Explore may describe the declared analysis. It may never alter it.
3. Per-sample thresholds: the exchange that matters most
A standalone clusterer names a cluster by pooling every cell, computing a median per marker, and putting a colour scale on it. Three things are wrong with that on multi-sample data, and all three are things cyRAVEN has already solved for the declared path:
- The pooled median is not a threshold. It is the middle of the distribution, which for a marker where 80% of cells are positive sits inside the positive population.
- It ignores staining variation between samples. A bright sample and a dim one are compared against one number, which is precisely the systematic bias that per-sample gating exists to remove.
- It produces a colour, not a call. “Reddish for CD19” is not a measurement.
Under --maybe-learn, explore reads
thresholds_used.csv and calls each cell against its
own sample’s cut. A cluster’s phenotype becomes:
CD19+ HLA-DR+ CD3- CD14-where every + means this fraction of the cluster’s
cells were above the threshold derived in their own sample,
recorded in frac_pos.<marker> columns. A marker the
cluster is mixed for is omitted rather than called
either way, so the phenotype string admits what it does not know.
That is a claim no standalone clusterer can make, and it is not a clever algorithm. It is the reuse of work the declared path already did.
4. Two things explore can do that the declared path cannot
It keeps the samples staining QC excluded. A sample
with no resolvable CD45 mode has no usable parent gate, so every
declared percentage from it would be a fraction of an arbitrary slice of
the scatter plot. The declared path must drop it. Explore does not
depend on that gate, so those samples still contribute, and
staining_qc_verdict is a column rather than a
filter. On the KMT2 cohort analysed in this project that is three donors
the declared path had to discard and explore can still describe.
It looks outside the parent gate. Anything the CD45 gate excluded is invisible to the declared analysis by construction. Explore embeds it, which is how a population that fails the parent gate can still be seen.
5. Carrying the confounding verdict
The most likely way explore mode could damage this package is by becoming a p-value generator that ignores everything the declared path established.
explore_cluster_stats.csv therefore carries
batch_group_cramers_v and batch_group_verdict
as columns of the results table itself, not as a note elsewhere. On a
cohort where batch and group are confounded, a q < 0.05 on a
cluster means exactly as little as a q < 0.05 on a declared
population, and the table says so on the same row.
Explore’s statistics are also donor-level, using the same
stats_group_comparison() the declared path uses: one value
per sample, Kruskal-Wallis omnibus, Wilcoxon pairwise, Cliff’s delta,
Benjamini-Hochberg. Not a reimplementation: the same function, so the
two cannot drift apart.
6. Why the draft specification is never adopted automatically
explore_suggested_spec.yaml turns clusters into
declarable population definitions. The obvious next step, feeding it
straight back into the declared pipeline, is refused, and this is a
central design decision in the feature.
cyRAVEN’s argument is that populations are declared before the data are examined, and six diagnostics then try to falsify that declaration. Derive the specification from the same data and the diagnostics become circular:
- Phenotype concordance asks whether a population expresses the markers its definition demands. Trivially yes, if the definition was read off those cells.
- Gate-cluster concordance compares declared gates against unsupervised clusters. If the gates came from those clusters, it compares a thing to itself.
There is a sharper version. Explore’s clustering is
group-blind. It never sees cohort labels, so deriving a
definition from cluster phenotypes is a mild form of
double-dipping. But explore_cluster_stats.csv
does test by group. A user who reads that table, sees
which clusters differ, and declares those as populations has selected on
the outcome, and every subsequent p-value is invalid.
The defensible uses, ranked:
| Workflow | Verdict |
|---|---|
| Explore on cohort A -> curate -> declared run on cohort B | Clean. The intended loop |
| Explore -> curate -> declared run on the same cohort, reporting frequencies | Acceptable; state that the spec was data-derived |
| Explore -> read the group statistics -> declare the clusters that differed | Invalid. Selection on the outcome |
Hence: a YAML file whose header says it is a suggestion, requiring a human edit, with no flag anywhere that adopts it.
7. Choices inherited rather than invented
Three decisions were taken from the unsupervised literature because they are better than what a supervised tool would reach for.
Cluster everything, including scatter and viability.
No lineage preference. This is what lets the QC gate find debris
(leukocyte marker low), dead cells (viability high) and granulocytes,
which no antibody in most panels identifies. The cost is real: some
clusters split on scatter rather than lineage.
--explore-markers overrides it.
Gate on clusters, not events. Cluster coarsely
first, then judge whole clusters by their median profile, so no
per-event cutoff is invented. The units judged are the SOM nodes rather
than the merged clusters, because a merge can join debris to the
CD45-dim cells beside it. The debris and dead calls come from 2-means on
the per-node medians when nothing better is available, and from
per-sample thresholds when it is. Both are recorded in the
basis column of explore_qc_clusters.csv.
Refuse a gate that keeps almost nothing. Below
--explore-min-retained (default 5%), the gate is ignored
and the run flagged: at that point the markers are likelier mis-named
than the data bad.
One decision goes the other way. Cells are re-equalised per sample after the gate. cyCONDOR does not do this, and its faceted panels then differ in density for a reason that is group size rather than biology. That trap was documented while running it during this project. Equalising costs cells and buys panels that can honestly be read side by side.
8. Where this leaves cyRAVEN
Compared with FlowSOM, Phenograph, cyCONDOR, diffcyt and CATALYST:
| Capability | cyRAVEN | Also in |
|---|---|---|
| Per-sample gate derivation | yes | none of them |
| Uncertainty carried to every frequency | yes | none of them |
| Detection limits per population | yes | none of them |
| Donor-level inference by construction | yes | diffcyt; possible but not enforced in cyCONDOR and CATALYST |
| Refuses batch correction when confounded | yes | none of them |
| Unsupervised discovery | yes | all of them |
| Clusters named from per-sample thresholds | yes | none of them |
| Cluster turned into gate geometry | yes | none of them |
| Gating-ML 2.0 export | yes | none of them |
| Empirical-Bayes moderation across clusters | no | diffcyt |
| Trajectory inference | no | cyCONDOR |
| Cluster count found from the data | no | Phenograph, and cyCONDOR through it. FlowSOM and CATALYST are given the count |
The gap this feature closes is the “unsupervised discovery” row. The row that remains distinctive is clusters named from per-sample thresholds, which requires both halves in one tool and is why bolting FlowSOM onto a supervised pipeline is not the same thing.
What is deliberately not adopted
diffcyt’s empirical-Bayes moderation as the primary
test (edgeR, limma-voom, GLMM). It borrows strength across
clusters via a shared dispersion prior, which pays off at mass-cytometry
marker counts with hundreds of clusters. On a declared panel of a dozen
populations there is little to borrow, so the rank tests on one value
per donor stay primary. The edgeR form, with diffcyt-DA-edgeR’s defaults
applied to each sample’s exclusive-label counts, is available beside
them with --edger; limma-voom and the GLMM are not
implemented.
A data-determined cluster count. Phenograph and
consensus methods choose k from the data.
--explore-k is a setting, and
explore_provenance.csv says so, because a k chosen
from the data is one more thing the significance count depends on.
Trajectory inference. Diffusion maps and pseudotime need a differentiation continuum the design supports. On cross-sectional human cohorts of 10 to 40 samples it produces a picture, not a measurement.
9. The claim worth testing
If there is a methods paper here, the claim is not “cyRAVEN clusters cells”. It is:
Threshold placement uncertainty, derived per sample and propagated to reported frequencies, predicts the between-operator variance that manual gating produces, and that populations whose propagated uncertainty is large are the ones where published cohorts disagree.
That is falsifiable and, as far as this project’s reading goes, untested. It would need the same files gated by several operators, with the propagated uncertainty compared against the observed spread of their results. The inter-laboratory data to do it exists in the literature this package already cites.
The second claim, weaker but easier to support: a refusal rule is a feature. A tool that declines to run batch correction above a measured Cramér’s V between batch and group, and says why, produces fewer results and more defensible ones. That one needs a demonstration rather than a benchmark: a cohort where correction would have produced a clean, wrong answer.
See also
- Explore mode: how to run it
- Statistics: why the donor is the unit of replication
- Interoperability: handing a cyCONDOR clustering back
- Scope: nine excluded methods and the conditions for each