
Five things beyond a first run: finding a population nobody declared, checking whether the specification held, reading every file a run writes, the statistics and their assumptions, and using cyRAVEN alongside other tools.
The order is the one a result is actually interrogated in. Explore mode comes first because it can contradict the specification from outside it. The diagnostics come next, in reading order, since each stage can invalidate every stage after it. Then the output files, then the tests, then interoperability.
Explore mode: unsupervised discovery
Unsupervised discovery, run beside the declared analysis or on its own.
The rest of cyRAVEN starts from a specification: you declare populations, it scores them, and six diagnostics try to break the declaration. That design has one structural limit. It cannot find a population nobody declared, and it cannot look outside the parent gate, because both are consequences of the declaration itself.
Explore mode is the complement. It takes the single cells of every file and every eligible channel, embeds and clusters without reference to any specification, and reports what it found. It is what FlowSOM, Phenograph and cyCONDOR do. The cells are drawn from inside the scatter and singlet gates, which need neither the specification nor CD45, because debris and doublets would otherwise form clusters of their own; dead cells and non-leukocytes are judged afterwards by the cluster-level QC gate.
Everything it writes lands in <outdir>/explore/.
No existing output changes.
1. Why run it here rather than in a clustering package
An unsupervised tool hands you cluster 17 and a heatmap, and you decide what it is by eye. That inference is done on pooled data, on a colour scale whose limits you chose, with no per-sample calibration behind it.
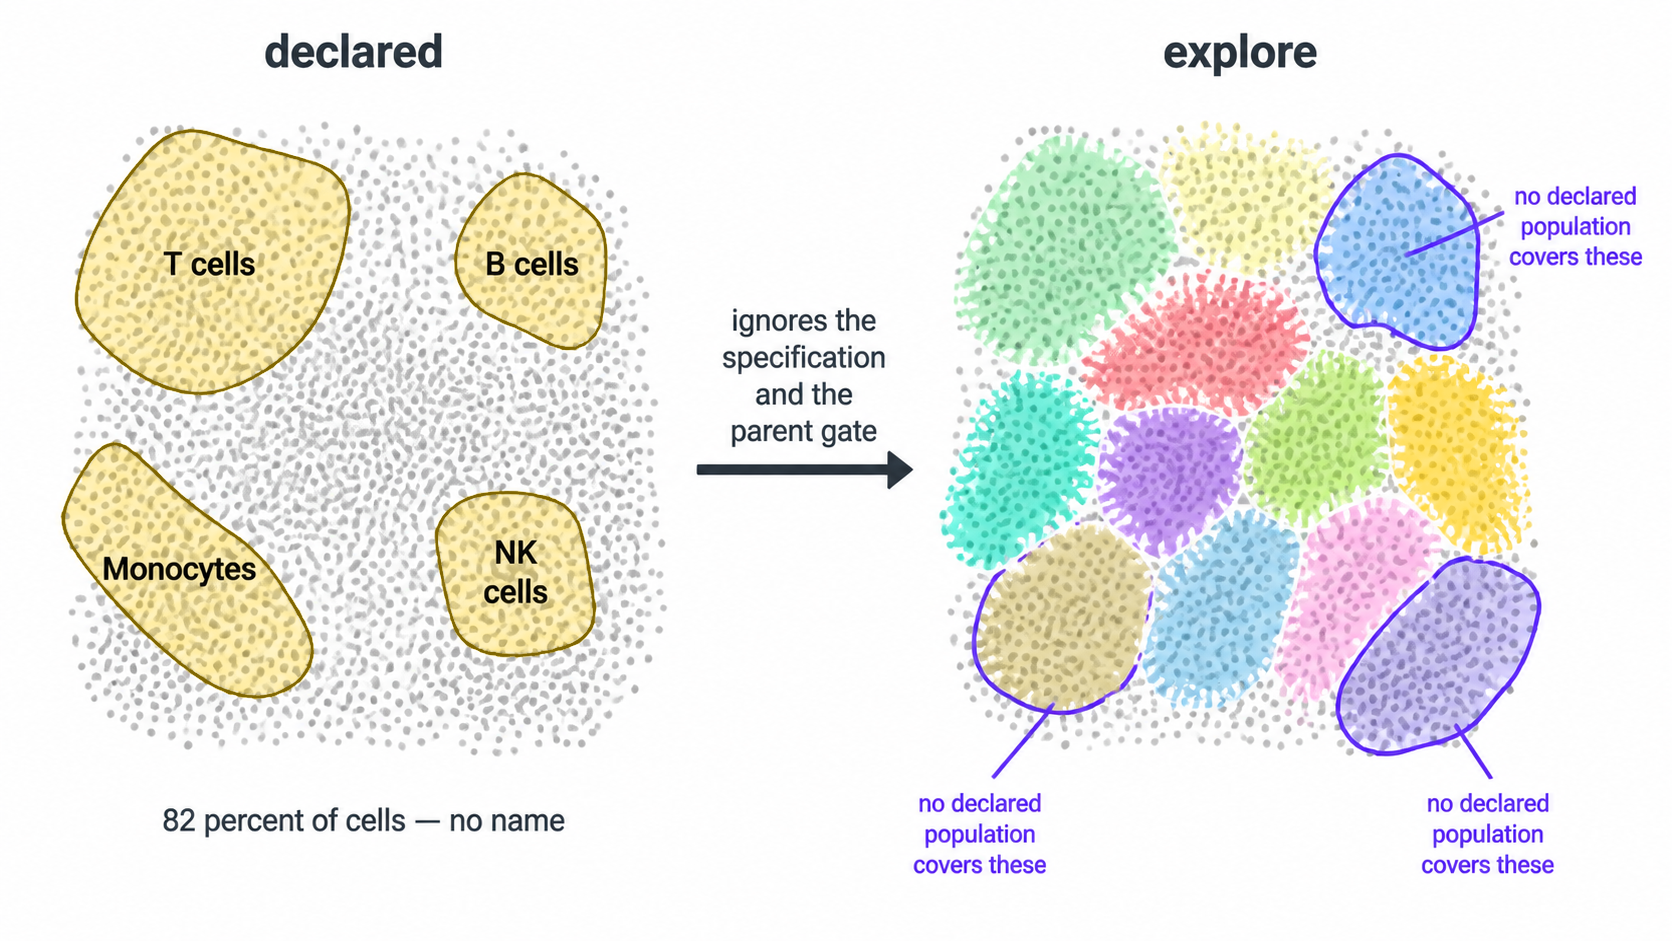
With --maybe-learn, this module has things a standalone
clusterer does not:
| From the declared run | What explore does with it |
|---|---|
| The transform, cofactor estimated on this panel | Clusters on the same scale the gates were drawn on, instead of an assumed default |
| A threshold for every marker in every sample | Names each cluster from the fraction of its cells above that sample’s own cut |
| Staining QC verdicts | Records them per cell, without excluding. See section 5 |
| The batch/group confounding verdict | Carries it into the cluster statistics, so a q-value cannot be read without it |
The result is a phenotype with a measurement behind it:
CD19+ HLA-DR+ CD3- CD14-, where every call is a percentage
of cells above their own sample’s threshold, rather than a colour you
interpreted.
Run without --maybe-learn, explore is blind: it sees the
transform and the group labels and nothing else. It names its clusters
against cuts it places on each sample’s own cells by the declared run’s
rule (a valley, else a tail gate above the dominant mode), reading none
of the declared run’s cuts, and calls a cluster debris when most of its
cells sit below its file’s CD45 debris reference, the 99.5th percentile
of CD45 on the events the scatter gate rejects, as the declared CD45
gate defines CD45-negative. A pooled median, used before for the names,
calls half of all cells positive for every marker; a 2-means split of
cluster medians, used before for debris, cut through CD45-dim cells on
PBMC. Blind is the right default, and section 6 explains why.
2. The three ways to run it
Alongside the declared analysis
docker run --rm \
  -v "$PWD/data:/data:ro" \
  -v "$PWD/results:/results" \
  cyraven:1.0.0 \
  --dir /data/fcs \
  --samples /data/samples.csv \
  --config /data/panel.yaml \
  --group-column cohort \
  --reference-group "Healthy controls" \
  --cluster \
  --explore \
  --outdir /results
Both analyses run. The declared deliverables are byte-identical to a
run without the flag; explore’s outputs are in
results/explore/.
Standalone, with no specification at all
docker run --rm \
  -v "$PWD/data:/data:ro" \
  -v "$PWD/results:/results" \
  cyraven:1.0.0 \
  --dir /data/fcs \
  --explore-only \
  --outdir /results
No --config, no --samples, no populations.
Just a folder of FCS files. This is the mode for a panel you have not
written a specification for yet, and
explore_suggested_spec.yaml is where you get a first draft
of one.
3. What it clusters on
Every eligible channel, including scatter and viability. No lineage preference, no exclusions. That is the unsupervised default and it is deliberate: it is what lets the QC gate find debris (CD45 low), dead cells (viability high) and granulocytes (side scatter high, identified by no antibody in most panels).
The cost: some clusters will split on scatter rather than on lineage. If that is not what you want:
4. The quality gate
cyRAVEN’s declared path starts by gating CD45-positive leukocytes. Explore mode cannot: a declared parent gate is exactly what it is meant to work without.
So it uses the cluster-level gate the unsupervised family uses. Cluster coarsely first, then judge whole clusters by their marker profile, so no per-event cutoff is invented. The units judged are the SOM nodes (100 on the default 10 × 10 grid), not the merged clusters: a merge can join debris to CD45-dim cells that border it, such as low-density granulocytes in PBMC, and whether it does depends on the seed. Node by node, the same rule keeps those cells at every seed.
| Call | Rule |
|---|---|
debris |
Leukocyte marker low across the cluster |
dead |
Viability dye high across the cluster |
saturated |
Top percentile in most channels at once. No real cell type is, so these are aggregates and doublets |
Saturation is decided first: an aggregate is bright in the leukocyte marker too, so calling it debris would mislabel it.
Under --maybe-learn the debris and dead calls are made
against each sample’s own thresholds. Without it they come from 2-means
on the per-node medians, which is what a standalone tool has. Either way
explore_qc_clusters.csv records the call and the
basis for it per node, with the merged cluster each node
belongs to.
If the gate would keep less than --explore-min-retained
(default 5%), it is ignored and the run flagged: at that point the
markers are more likely mis-named than the data bad.
5. Two things it does that the declared path cannot
It keeps the samples staining QC excluded. A sample
with no resolvable CD45 mode has no usable parent gate, so the declared
path must drop it: every percentage would be a fraction of an arbitrary
slice. Explore does not depend on that gate, so those samples still
contribute, and staining_qc_verdict is a column rather than
a filter. On a cohort where three samples failed, that is three donors
you can still say something about.
It looks outside the parent gate. Anything the CD45 gate excluded is invisible to the declared analysis by construction. Explore embeds it.
6. --maybe-learn, and why it is off by default
Without the flag the two analyses are computed in complete isolation. That is not caution for its own sake:
- An explore run that used the declared thresholds is no longer a blind unsupervised run. If you want to compare cyRAVEN’s clusters against another tool’s, or check whether the specification is any good, the check has to be independent of the thing being checked.
- A declared run carrying a diagnostic derived from clusters is no longer the run its manifest describes.
With the flag, both directions open:
Declared to explore. Per-sample thresholds name the clusters, QC verdicts are recorded, the confounding verdict is attached to the statistics, and the bridge tables against the declared populations are written.
Explore to declared. One file appears in the run
directory: spec_gaps.csv, with two kinds of row.
issue |
Meaning |
|---|---|
population spans several clusters |
The declared label lumps distinct phenotypes. Its total can be flat while a subset inside it moves |
cluster no declared population covers |
Something in the blood nobody declared |
The first row type is the one worth the flag. A declared population whose total does not differ between groups, while a cluster inside it does, is invisible to any amount of testing on the declared table, and it is a real pattern, not a hypothetical.
7. What it writes
All in <outdir>/explore/.
| File | Content |
|---|---|
explore_report.html |
Start here. Self-contained, every figure and table embedded |
explore_cluster_profile.csv |
Per cluster: size, phenotype string, fraction positive and median per channel |
explore_qc_clusters.csv |
The gate: call and basis per coarse cluster |
explore_cluster_abundance.csv |
Per donor per cluster, with counting uncertainty and LOD/LOQ |
explore_cluster_stats.csv |
Group tests, donor-level, with the confounding verdict attached |
explore_cells.csv |
One row per cell: sample, event index, cluster, UMAP coordinates |
explore_vs_populations.csv |
Cross-tab against the declared labels |
explore_findings.csv |
Clusters no declared population covers |
explore_population_split.csv |
Declared labels spanning several clusters |
explore_suggested_spec.yaml |
A draft specification, for curation |
explore_provenance.csv |
Every choice made, and on what basis |
Figures: explore_umap_clusters.png,
explore_cluster_heatmap.png,
explore_umap_by_group.png,
explore_umap_markers.png, and
explore_marker_umaps_by_group/, one panel per group per
marker, on the shared embedding.
The report is separate from report.html rather than a
section inside it, for the reason in section 8: report.html
is a declared deliverable and --explore must not change
it.
What each cluster corresponds to, and what it is
Two questions, two answers, and they can disagree.
Correspondence is measured by which cells overlap.
explore_cluster_identity.png puts clusters in rows and
declared populations in columns, grouped by the population each cluster
best matches. The match is scored by the F1 statistic,
the harmonic mean of precision (how much of the cluster is that
population) and recall (how much of that population is in the cluster),
rather than by the largest overlap. The distinction matters: a cluster
of 500 cells holding 300 CD4 T cells has CD4 as its plurality even when
those 300 are a twentieth of the CD4 T cells in the run. The label would
describe the cluster; the cluster would not describe the label. F1 can
only be high when both directions hold. The method follows Weber &
Robinson, Cytometry A 2016;89:1084-1096, who match clusters to
manually gated populations this way.
Every cluster has a best match, so the call is qualified rather than
asserted: confident at F1 ≥ 0.5, partial, or
no clear match, all written to
explore_cluster_identity.csv with the precision and recall
behind them.
The catch-all is ranked apart, because it is the complement of the specification rather than a cell type. Letting it compete would name most clusters “Other” on a specification with modest coverage, which is true but not informative. A cluster at or above 70% catch-all is reported as undescribed, which is a gap in the specification rather than a property of the cluster. A cluster half or more catch-all is never called confident, however clean its F1 against the remainder.
Identity is read from the cluster’s own marker
profile. explore_cluster_subsets.csv matches each cluster’s
positivity fractions against the immune subsets the panel can express
(activated, exhausted and homing T cell subsets, NK CD56 bright/dim,
HLA-DR low and CD38+ monocytes, and so on) and takes the most specific
definition the profile satisfies. The base lineages are candidates too,
so a cluster of plain CD4 T cells is named rather than left blank. The
margin column is the smallest distance from the positivity
cut across the requirements that were checked: a cluster 51% positive
for a marker satisfies the same requirement as one 99% positive, and
only the margin separates them.
This is written whether or not a specification was scored, so an explore-only run still gets it.
The subsets a panel can define are a property of the panel, not of immunology. Only definitions whose every marker is present are proposed, and the canonical groups that cannot be reached are named in the log with the markers they would need: naive/central-memory/effector-memory without CD45RA and CCR7, the three monocyte subsets without CD16, senescent T cells without CD28.
The subsets are not added to the declared specification. Appending them there re-scores every cell, changes every frequency and legend, and asks a circular question of a subset named after the marker that defines it: a CD69+ subset is 100% CD69-positive by construction. The annotation attaches to the cluster, never to the cell, and no declared output changes.
The heatmap is fractions, not medians
explore_cluster_heatmap.png plots the fraction
of each cluster positive for each marker, not the median
expression. A median is a number on a transformed scale whose apparent
meaning depends on the colour limits you chose. A fraction positive is
“this share of the cluster is above its own sample’s cut”, which is the
same quantity a person reads a gate for.
8. The isolation guarantee
--explore must not alter a single byte of the declared
deliverables. That is tested rather than asserted: the demonstration
cohort is run with and without the flag and every top-level output
compared byte-for-byte, excluding only run_manifest.txt and
report.html, which embed a timestamp.
The two new tables in section 9 are the one intended change, and they appear on every run, with or without explore.
spec_gaps.csv is the only file explore is ever allowed
to add to the declared output, and only under
--maybe-learn.
9. The statistics catalogue
Two files now appear in the normal output on every run, and they exist because a reader arriving from an immunophenotyping paper expects t-tests and ANOVA and finds rank tests instead.
statistical_methods.csv lists every
commonly reported method: Student’s and Welch’s t, one-way and
two-way ANOVA with Tukey, repeated measures, Mann-Whitney,
Kruskal-Wallis with Dunn, chi-squared, Bonferroni, and the
cytometry-specific diffcyt family (edgeR, limma-voom, GLMM), and for
each one says whether this run computed it and why. The
edgeR form runs with --edger.
normality_tests.csv carries the
evidence: a Shapiro-Wilk test per population per group, and a
Brown-Forsythe test for equal variances across groups. Those are the two
assumptions a t-test or ANOVA rests on.
What it will usually show, and the reason the
interpretation column exists: Shapiro-Wilk on 4 to 10
donors has almost no power, so a non-significant result is
not evidence of normality. That is why the rank test is
used, and the table says so rather than leaving a reader to conclude “p
> 0.05, so a t-test would have been fine”.
What does not happen: running every test and reporting all the p-values. At these group sizes that is p-hacking with extra steps.
10. Options
| Option | Default | Effect |
|---|---|---|
--explore |
off | Run explore alongside the declared analysis |
--explore-only |
off | Run only explore; no specification needed |
--maybe-learn |
off | Let the two analyses inform each other, both ways |
--explore-k |
20 | Metaclusters |
--explore-qc-k |
20 | Merged clusters of the coarse QC clustering; the gate judges their SOM nodes |
--explore-grid |
10 | SOM grid side |
--explore-neighbors |
30 | UMAP n_neighbors for the explore embedding |
--explore-min-dist |
0.1 | UMAP min_dist for the explore embedding, separate from
--min-dist (0.3) |
--explore-cells-per-sample |
6000 | Cells drawn per sample before the gate |
--explore-max-cells |
150000 | Ceiling across all samples |
--explore-markers |
every channel | Cluster on these only |
--explore-exclude |
none | Drop these channels |
--no-explore-qc |
off | Embed every single cell, dead and CD45-negative cells included |
--explore-keep-dead |
off | Keep the dead cluster |
--no-explore-equalise |
off | Keep every gated cell instead of equalising per sample |
--explore-min-retained |
0.05 | Ignore the gate below this retention and flag the run |
--no-explore-spec |
off | Skip the draft specification |
11. What explore mode is not
It is a hypothesis generator. A cluster is not a population until it has been declared, thresholded per sample, and checked.
The intended path is a loop: explore finds something to you curate
explore_suggested_spec.yaml into a real specification to
the supervised path scores it with per-sample thresholds, propagated
uncertainty and the six specification checks to and if it survives,
--explain-clusters and --export-gates turn it
into gate geometry a sorter can be driven with.
Discovery is the beginning of that loop, not the end of it.
See also
- Running cyRAVEN: every command, and which to use when
- Diagnostics: the checks in reading order
- Statistics: why the donor is the unit of replication
- Interoperability: handing a cyCONDOR clustering to cyRAVEN
Diagnostics, in reading order
Population labels in cyRAVEN derive from a specification declared before the data were examined. That specification is a hypothesis about how the panel behaves across the batch, and it can fail in ways that a frequency table cannot express. The outputs below exist to detect those failures.
Sections 1 to 3 are sufficient to reject most compromised runs and
should be read first. report.html presents all of them in
this order, embedded in one self-contained file.
0. Before the run: --check
Every check below is applied to a run that has already happened. Some failures are knowable before it starts, from the FCS headers alone: a file the sample sheet has no row for, a specification naming markers the panel does not contain, a group column that does not exist or has one level, a subject whose rows disagree about that subject.
docker run --rm \
  -v "$PWD/data:/data:ro" \
  -v "$PWD/results:/results" \
  cyraven:1.0.0 \
  --dir /data/fcs \
  --samples /data/samples.csv \
  --config /data/analysis.yaml \
  --outdir /results \
  --check
It reads keyword blocks rather than events, so it costs seconds
regardless of cohort size, and writes nothing. A marker name that does
not match $PnS exactly is the most common cause of an empty
frequency table, and it is the first thing --check
reports.
Run it after every edit to either input file.
1. Gate inspection
recon_diagnostics.png and gating_qc.png are
written unconditionally and show, per sample, the scatter gate boundary,
the singlet band, and every marker threshold superimposed on the density
from which it was derived.
A threshold placed on a distribution shoulder rather than a minimum is visible here and is not detectable in any downstream table.
1a. Acquisition stability
Every number reported for a sample is derived from that sample’s pooled events, which is correct only if the instrument behaved the same way throughout the acquisition. A partial clog, a bubble or a drift in laser power makes a file two instruments over its run, and one threshold then suits neither half.
acquisition_qc.csv bins the Time channel into
equal-width intervals and tracks two quantities across them: the event
rate, which a clog lowers and a bubble spikes, and each channel’s
median, which catches a shift the rate does not show. Bins are equal in
time rather than in count, because a bin holding a fixed number of
events cannot reveal that the rate changed.
acquisition_qc.png draws the rate per sample with the
flagged intervals marked, and acquisition_qc_bins.csv holds
the per-interval detail.
Nothing is removed. acquisition_qc_impact.csv states how
far each population would move if the flagged intervals were excluded,
and that is the number the decision rests on: a file with a visible
anomaly that moves no population by more than its own gate uncertainty
does not need re-acquiring. Compare pct_delta_if_cleaned
against u_pct_points for the same population before
concluding anything. --drop-unstable-events performs the
exclusion and is recorded in the manifest.
A file carrying no Time channel is reported as such rather than as stable.
1b. Why a threshold did not resolve
Section 1 shows that a marker had no density minimum and got
a tail gate. spreading_receivers.csv and
spreading_pairs.csv are what distinguish the two reasons it
can have.
Compensation removes the mean contribution of one fluorochrome to another detector. It cannot remove the photon-counting variance that came with it, so a receiver channel’s negative population is wider wherever a spilling source is bright. A widened negative fills the density valley a threshold would sit in, and no gating strategy recovers a minimum that the optics erased.
spreading_pairs.csv reports, for every ordered source
and receiver pair, the ratio of the receiver’s negative spread when the
source is bright to its spread when the source is dim.
spreading_receivers.csv ranks receivers by their worst
source and pairs that against how often the marker had no density
minimum (fallback_rate, tail gates and quantiles
together).
Read the two columns together. A marker with a high fallback rate and substantial spreading is failing for a panel design reason, and the fix is a different fluorochrome assignment rather than a different threshold method. A marker with a high fallback rate and no spreading is failing for some other reason: too few positive events, a titration problem, or a continuous distribution. Reporting the fallback rate alone cannot tell those apart.
2. Staining QC
staining_qc.csv records a per-sample verdict. A sample
with no resolvable CD45+ mode contains no usable parent gate;
it is excluded and the exclusion reported, rather than contributing a
spurious frequency to a group mean. Samples declared as controls through
the is_control column of the sample map are excluded from
testing without being recorded as failures.
--include-qc-failed overrides exclusion for
inspection.
3. Phenotype concordance
population_marker_heatmap.png displays marker intensity
against declared populations, z-scored across the run.
In clustering-first analysis this figure assigns identity. Here
identity is already declared, so the figure serves the inverse function:
a column labelled CD4 T cells that does not show elevated CD4 and
depressed CD8 falsifies the gate that produced it. The figure outlines
the markers each population’s specification requires to be positive,
reading the same populations: block used for scoring, so
the audit cannot diverge from the definitions being audited.
cohort_composition_heatmap.png normalises each group to
a common notional cell count before partitioning by population, which
prevents unequal sample numbers or acquisition depth from generating the
pattern.
4. Threshold drift
Per-sample thresholding introduces a specific hazard. If thresholds for a given marker differ systematically between study groups, the populations defined by that marker are not identically specified across the comparison, and any abundance difference is partly definitional.
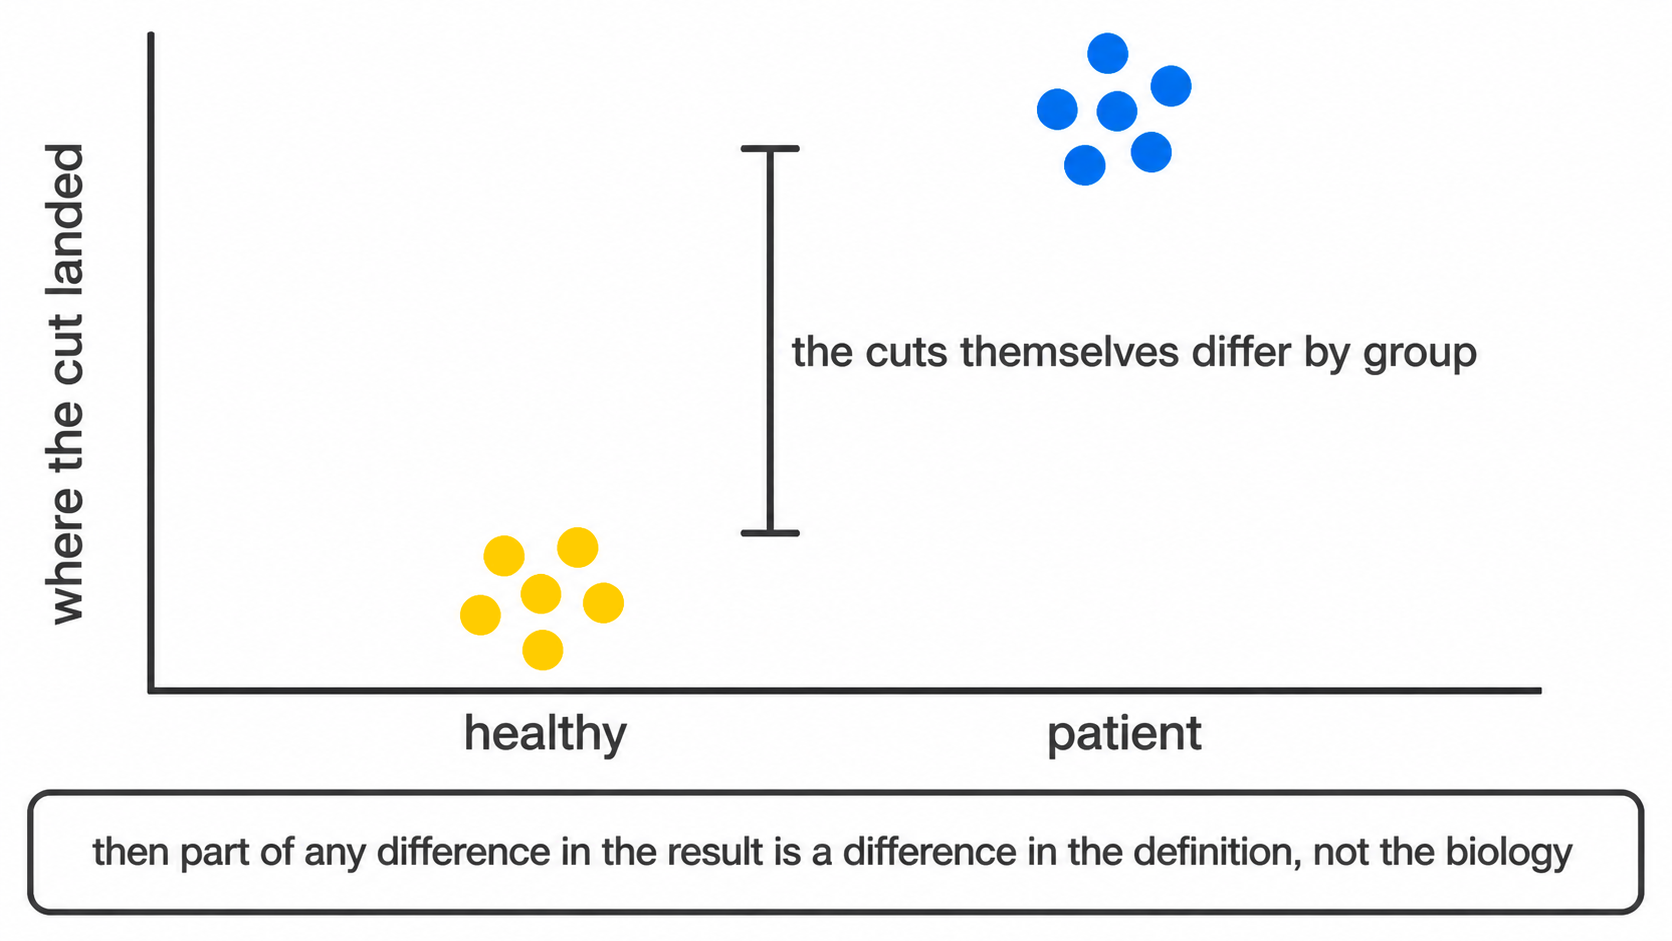
threshold_drift_stats.csv tests each marker’s per-sample
thresholds against group membership and flags those that separate. A
flagged marker invalidates naive interpretation of every population
depending on it.
No clustering-based method has an equivalent output, because none carries a prior definition capable of drifting.
5. Gate uncertainty
Threshold drift asks whether a cut sits in a different place for one group than another. This asks a prior question: how well is it determined at all.
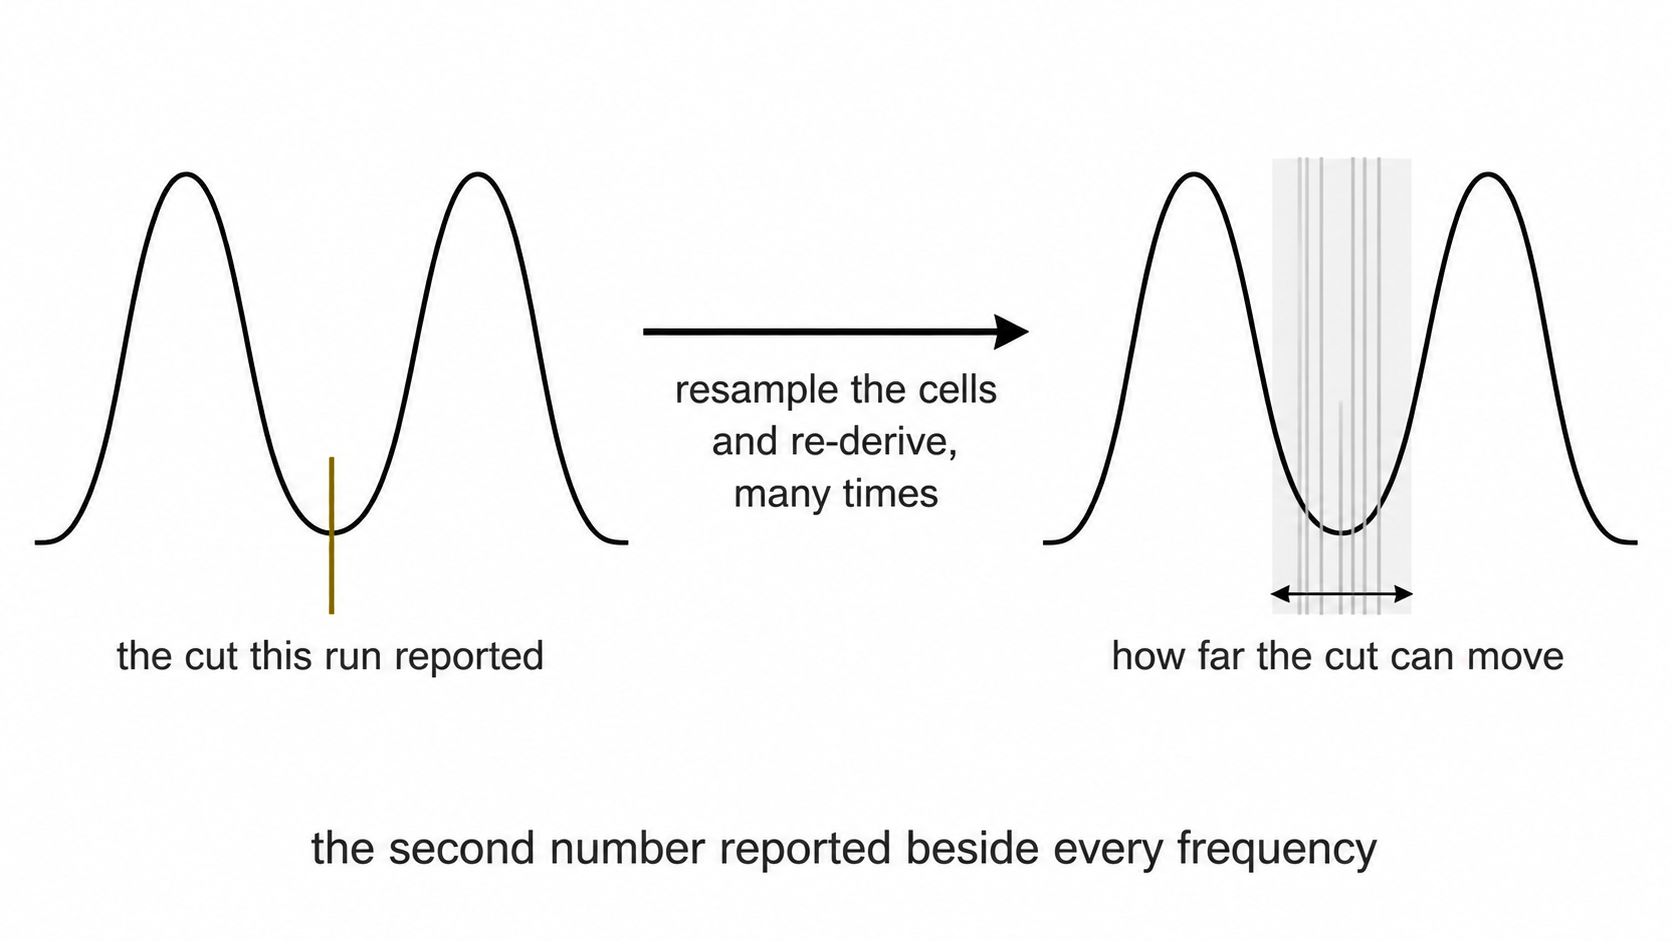
Each cut is re-derived from resamples of the events it was computed
on, and again across the settings that placed it, and the two spreads
combine in quadrature following the GUM convention.
threshold_uncertainty.csv reports both components.
uncertainty_budget.csv propagates them to each population,
with the CD45 parent gate as a term in every one, since it fixes the
denominator all frequencies are expressed against.
Read bootstrap_valley_rate before
u_combined. A cut recovered in every resample is a
population boundary. One recovered in half of them is histogram noise
that happened to clear the depth rule, and the two are written to
thresholds_used.csv in exactly the same way.
frequency_uncertainty.png places the two quantities side
by side: the spread between samples, and the bar within each. Where the
bars are as wide as the scatter, the variation on display is the cut
moving rather than the biology, and difference_over_gate_u
in the group comparison states the same thing for a tested difference.
Below one, the groups differ by less than the distance the threshold
itself travels under resampling.
The published figures for manual gating are the comparison worth making. Operator studies following the same convention report expanded uncertainty rising from around 12% on a three-gate strategy to around 16% on a five-gate one, with the first gate contributing most of it (Grant et al. 2021, Methods Protoc 4:24).
5a. Detection limits
The preceding section asks how well the cut is determined. This asks whether enough cells were counted for the answer to mean anything, which is a separate question with a separate failure mode: a cut through a wide empty gap is well determined however few events lie beyond it.
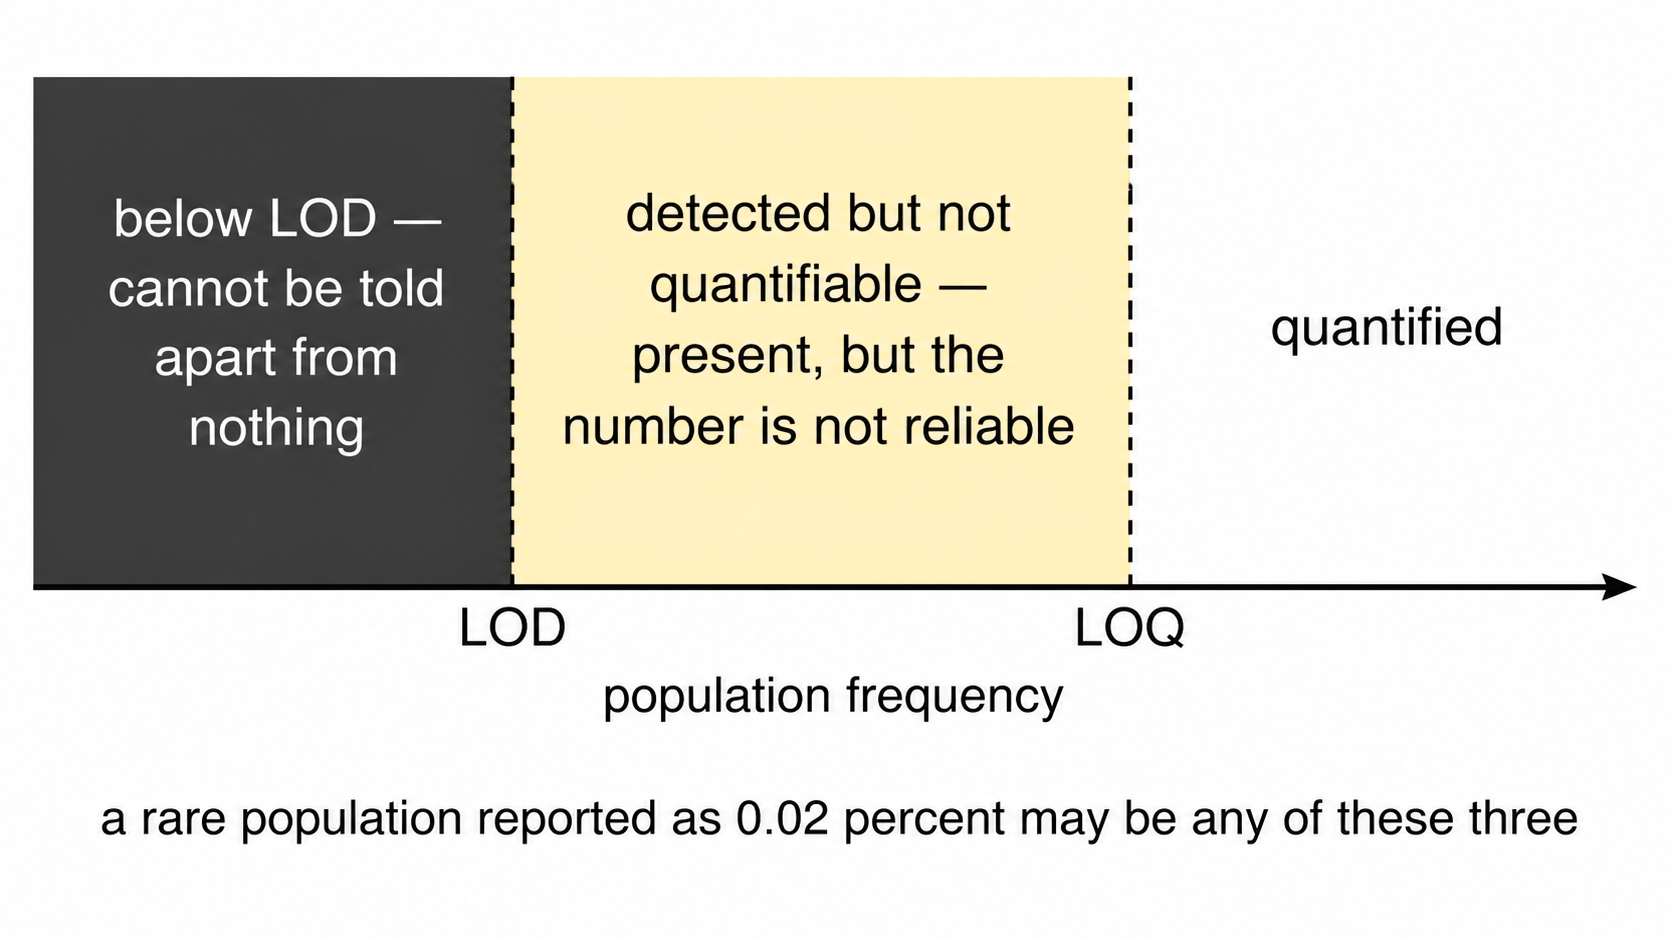
u_counting_pct_points in
population_frequencies.csv is the uncertainty the frequency
carries from its own event count, and u_total_pct_points
combines it with the gate term. difference_over_total_u in
the group comparison applies the same reading as
difference_over_gate_u against both components and is the
stricter of the two; the two separate exactly where a well-placed cut
sits in front of too few cells.
detection classifies each value against the conventional
twenty and fifty events, expressed as lod_pct and
loq_pct of that sample’s parent gate.
detection_limits.png counts how many samples clear each
limit, per population. Three readings:
A population quantified in every sample is measurable in this cohort.
A population mostly below the limit of quantification is not, and the
gating strategy is not the reason. The numerator is small because few
cells were acquired, so the remedies are a longer acquisition or a
higher --max-events-per-file, not a different
threshold.
A population split across the limit is the case to be careful with, because a group difference in it can be produced entirely by which samples happened to clear the limit.
Both limits are computed against the parent-gate events this run saw, so subsampling raises them proportionally. That is deliberate: it reports the resolution of the analysis that was actually performed rather than of the files on disk.
6. Cluster concordance
--cluster computes a self-organising map clustering of
the same cells without reference to the specification, then
cross-tabulates. Four configurations are diagnostic.
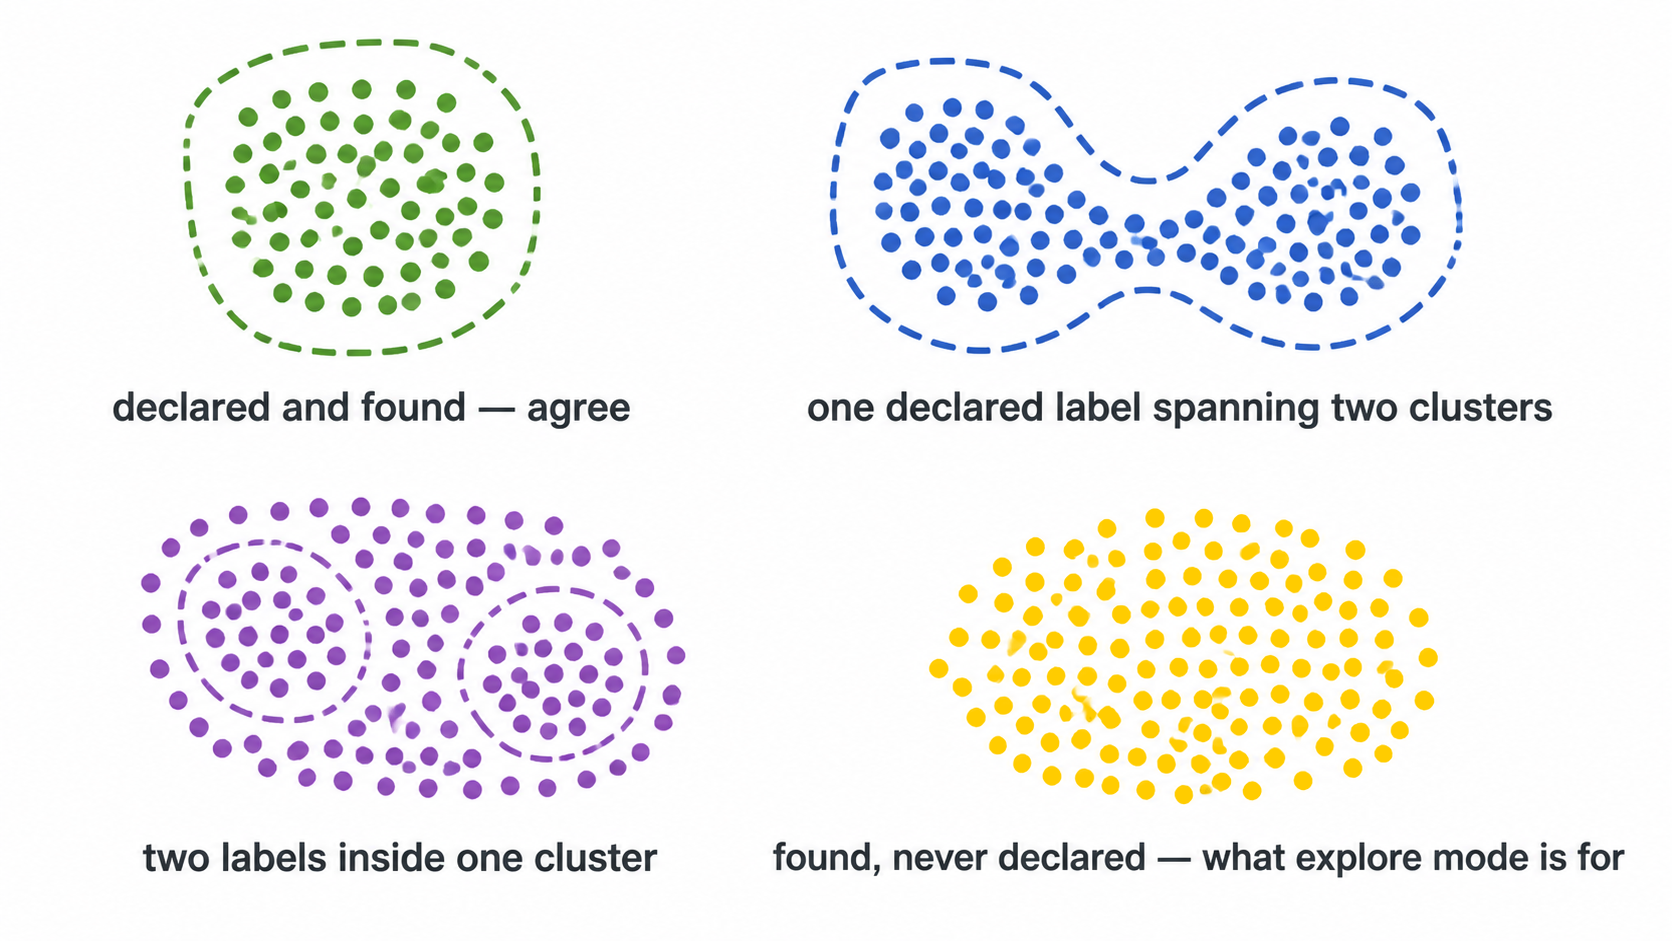
This check clusters WITHIN the parent gate, on the cells the
specification already selected. --explore is the wider
version: it clusters the single cells of the file over every eligible
channel, so it can also find a population the CD45 or viability gate
excluded. Under --maybe-learn it writes
spec_gaps.csv, which names declared populations that turn
out to span several clusters. See Explore
mode.
6.1 Concordant. A cluster composed predominantly of one declared label. The specification and the data agree.
6.2 Undescribed population. A cluster dominated by the unassigned label. A phenotypically coherent population exists that the specification does not describe. Supervised analysis cannot produce this finding, since it has no mechanism for detecting an entity it never declared.
6.3 Under-specified label. One declared label distributed across several clusters. The definition is coarser than the phenotypic structure. Where the constituent subsets respond in opposite directions, the aggregate frequency reports no change.
6.4 Misplaced threshold. A label containing substantially fewer cells than the cluster it dominates. If CD4 T cells score 0.3% while a cluster comprising 20% of events is CD4-bright and unassigned, the population is present and the Boolean rule is rejecting it. This is the diagnosis a frequency table structurally cannot deliver.
Output: cluster_gate_agreement_clusters.csv,
cluster_gate_agreement_populations.csv.
7. Gate transferability
A gate fitted to one cohort is worth having only if it selects the
same population in the next one. --external-labels takes a
cell labelling produced elsewhere, a cyCONDOR clustering for instance,
learns a strategy for it, and then withholds one donor at a time: the
whole strategy is refitted on the remaining donors and scored on the
donor that was held back.
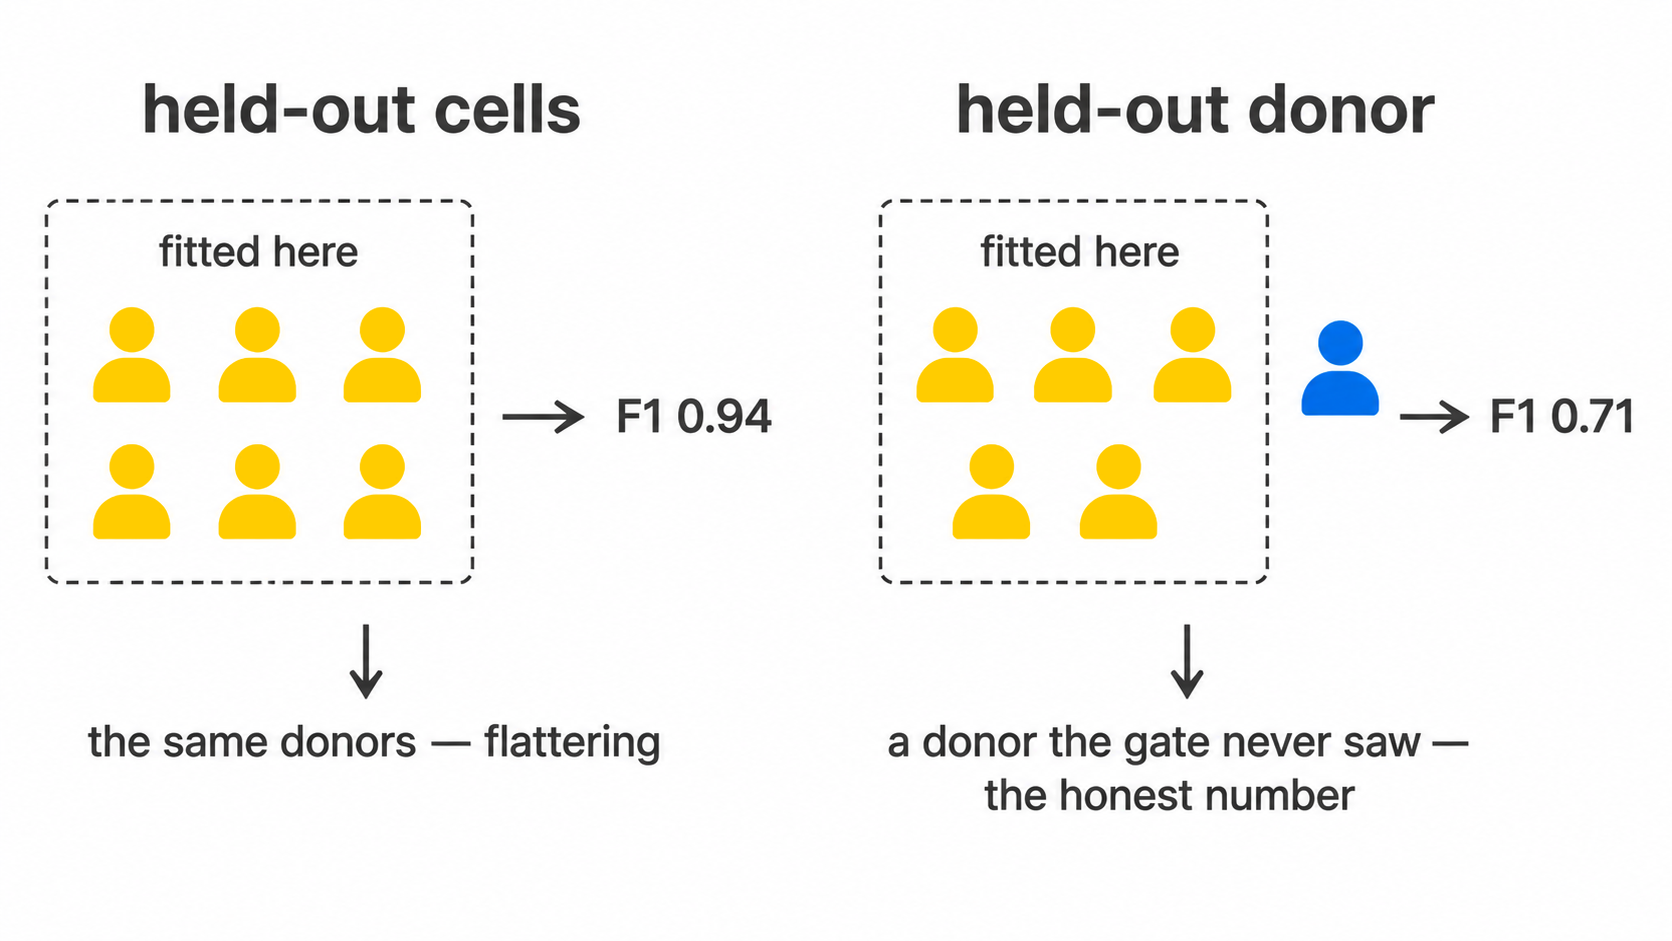
This is a different measurement from the held-out metric in section 8. Cells reserved from a fit come from the same donors, acquired in the same tubes on the same day, so they share every source of between-donor variation the gate will meet in use. A strategy can score an excellent held-out F1 on cells and still fail on the next patient.
gate_transferability_summary.csv reports the minimum,
median, maximum and IQR across donors. Read the minimum. A gate scoring
0.9 on every donor and a gate scoring 1.0 on nine donors and 0.1 on one
share a median and are not the same gate.
The join between the label file and this run is on sample and event
index rather than row position, because two tools subsample
independently and a positional join relabels every cell without raising
anything. join_external_labels() reports the matched
fraction and declines below a hundred cells.
Output: external_label_gates.csv,
gate_transferability.csv,
gate_transferability_summary.csv, and with
--export-gates, a Gating-ML 2.0 document in the linear
units the FCS file stores.
8. Gate geometry
A cluster index and a cell count are not actionable at the
instrument. --explain-clusters converts an undescribed
cluster into executable gate geometry.
For each qualifying cluster, cyRAVEN selects the two most discriminating markers, fits a convex polygon in that plane, retains the enclosed events, and recurses. The output is the topology of a manual gating strategy and can be reproduced by hand.
Convex polygons rather than rectangles: a conjunction of
one-dimensional thresholds is an axis-aligned rectangle, and CD4 against
CD8, CD14 against CD16, and FSC-A against FSC-H all separate along
oblique boundaries. A rectangle imposed on an oblique boundary must
either admit contaminating events or exclude genuine ones.
derive_singlet_band() is a hand-written instance of the
same geometry.
Every reported metric is computed on events held out of the fit, with the resubstitution value printed alongside. Eight free half-planes can memorise a few thousand events, so the difference between the two quantifies overfitting.
The stage is descriptive. A proposed gate localises events in marker space without asserting that they constitute a biological population. It carries no p-value, and scored frequencies and test results are identical whether it runs or not.
Output: cluster_gate_proposals.csv,
cluster_gate_polygons.csv,
cluster_gate_strategy_<k>.png.
9. Covariates
A variable confounds a comparison only when it both differs between groups and associates with the outcome within the groups. Either condition alone is inert, and flagging either alone would raise an alarm on any study with unequal age distributions.
confounding_diagnostics.csv reports both conditions
using tests estimable at small n, and assigns a
confounder_risk verdict. The outcome association is a
partial Spearman correlation with the group held fixed (a rank
F test for a categorical covariate): tested across the pooled
groups, a real group difference makes any unbalanced covariate track the
outcome by itself.
Adjustment is opt-in and kept separate. At single-digit n per group, a model carrying group with age and sex expends most residual degrees of freedom on nuisance terms. Where age is strongly associated with group, as in a syndrome-against-adult-control design, the parameters are not separable at any sample size: there are no young controls from which the age effect can be estimated independently. The adjusted estimate extrapolates beyond the observed covariate range and reports a confidence interval that does not reflect this.
--rank-ancova fits a rank-based ANCOVA where residual
degrees of freedom permit, labelling every row EXPLORATORY.
Where they do not, the output records NOT FITTED with the
reason rather than a value that would appear comparable to the others in
the folder.
9a. Clinical variables, which are the opposite question
--covariates names variables screened as
nuisances: the question is whether a group difference can be
believed in spite of them. --clinical-columns names
variables that are the question: a severity score, a laboratory
value, an outcome flag. Each is associated with every population and
every marker. The same column would be a different analysis under each
flag, which is why they are two flags.
One diagnostic belongs here rather than with the results.
clinical_variables_correlation.png reports the clinical
variables against each other, and is read before the association
heatmap. p-values there are adjusted within each variable on the grounds
that each variable is a separate question; in a cohort where the sickest
patients are also the ones who died, SOFA and 28-day survival describe
one gradient, and a population associated with both is one finding
counted twice. No correction repairs that, and nothing else in the run
would show it.
Read the effect and its bootstrap interval before the asterisk. At
the sample sizes these designs have, an interval spanning zero is the
usual outcome and is the informative part; underpowered
marks every test run on fewer than ten samples, where a null result
carries almost no information.
10. Batch structure
--batch-column names the variable identifying
acquisition batch. Absent that, the $DATE keyword is used
where it varies.
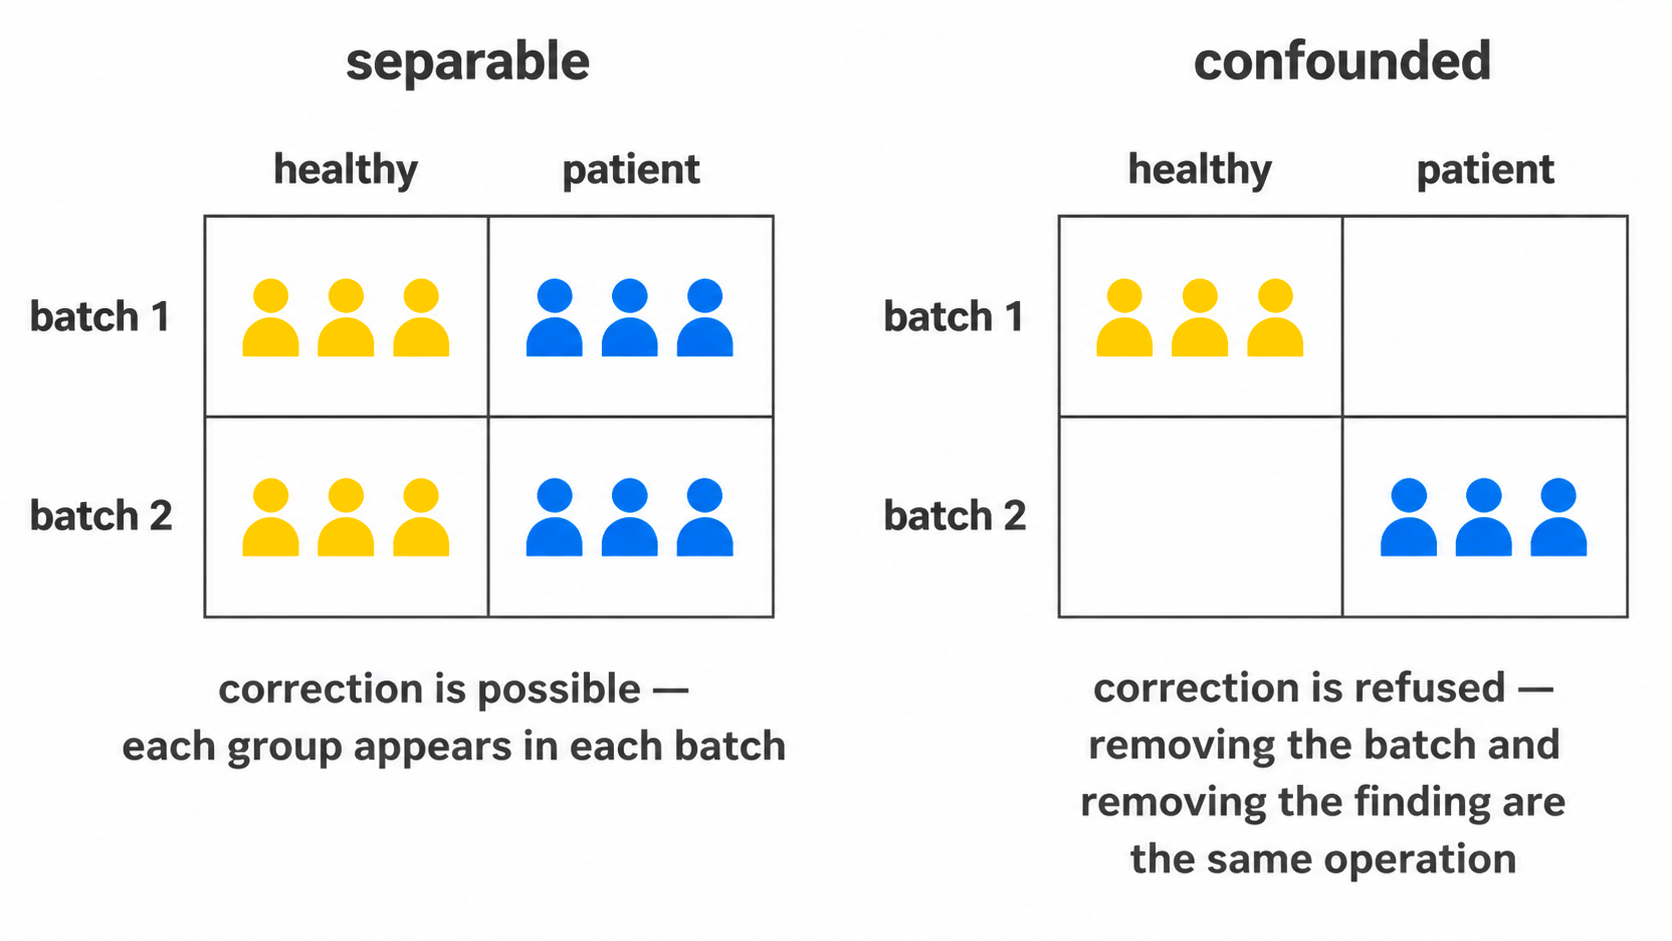
Two quantities are reported and both are required.
10.1 Magnitude. batch_mixing_stats.csv
reports iLISI, the metric against which Harmony is evaluated, together
with a permutation null. The null is necessary because the attainable
score depends on the number and relative sizes of the batches, so an
absolute iLISI is uninterpretable. Permuting batch labels and
recomputing yields the score this dataset would produce under no batch
structure.
10.2 Separability.
batch_group_confounding.csv reports Cramér’s V
between batch and study group, and between batch and timepoint where the
sheet has one. Where patients and controls were acquired in distinct
periods, V approaches unity and batch is not distinguishable
from the comparison of interest.
10.3 Which channel. The two quantities above are properties of the shared embedding. Neither identifies the marker responsible, and a flagged embedding does not correspond to any action at the bench.
marker_batch_drift.csv compares each marker’s
distribution between batches by Earth Mover’s distance, the L1 distance
between their empirical quantile functions. It is reported in analysis
units as emd_max, and divided by the marker’s own pooled
MAD as emd_over_mad, which is the comparable form: a marker
displaced by half its own spread is flagged regardless of the scale it
sits on. worst_pair names the two batches responsible.
threshold_batch_drift.csv is the test in section 4 with
batch substituted for study group. The two answer different questions
and both are needed. A threshold is one number per sample, so it
registers only drift that moves the cut; a marker can change its spread,
grow a tail, or lose the separation between its modes while the density
minimum between them stays exactly where it was. The distributional
comparison sees that, and the threshold comparison cannot.
A marker flagged in either is a statement about the assay rather than about the donors, unless batch and study group coincide, which is what 10.2 establishes and should be read first. Where V is high, neither table separates a reagent lot from the biology.
Correction proceeds only when both readings permit it.
--correct-batch aligns each marker across batches by
monotone quantile mapping; monotonicity guarantees that within-batch
cell ordering is preserved, so location and scale are adjusted without
introducing structure. Above --batch-max-cramers-v
correction is refused, since at that level of confounding removing the
batch effect and removing the biological effect are the same operation.
The default threshold is Cohen’s large association, w = 0.5, which is
V = 0.5 for a two-level table and smaller for larger ones (0.35
for three levels). --force-batch-correction overrides, and
the override is recorded in the run manifest.
--batch-method selects how the alignment is fitted, and
is read only after the refusal has been evaluated, so both methods are
refused on identical evidence. A better alignment algorithm does not
make a confounded design correctable.
quantile, the default, fits one map per marker over the
whole file. That is correct only when the batch effect is the same for
every cell, which it often is not: a shift in a detector moves a bright
population and a dim one by different amounts, so one map fitted to the
pooled distribution over-corrects one and under-corrects the other. A
per-file map also moves with the biology, so it can remove the
difference it was meant to preserve.
cluster fits one map per marker per cell type, which is
the published remedy and the method CytoNorm implements. Two stages, and
the second is not optional: clustering the raw matrix lets a large batch
shift become the dominant source of variance, so the clusters turn out
to be the batches, each holding one batch with nothing to align against.
The clustering is fitted on a whole-file-aligned copy and the
per-cluster maps on the original values. Measured on a synthetic
three-batch shift, the naive form left a mean between-batch gap of 1.296
against whole-file alignment’s 0.003; fitted correctly it reaches 0.014
while leaving the true between-cell-type separation at 3.996 against a
true 3.994, where whole-file alignment inflates it to 4.078.
cytonorm is accepted for cluster, with a note
in the log: it is not the CytoNorm package, which learns its maps from
anchor samples.
The goal each batch is aligned towards. Quantile
alignment maps each batch onto a goal distribution. A goal pooled over
every cell weights the batches by their cell counts and blends the study
groups, so where one batch holds mostly patients and another mostly
controls, aligning both to it pulls the groups together. Each study
group is therefore aligned on its own, towards the mean of its batches’
quantiles, which is CytoNorm’s goal (Van Gassen et al. 2020) tailored to
the design as CytoNorm 2.0 recommends (Quintelier et al. 2025). On a
planted two-batch, two-group example the pooled goal shrank a 2-unit
group difference to 1.2; the per-group goal kept 2.0 and removed the
batch shift. --batch-pooled-goal restores the pooled
form.
The clustering reuses the same seeded, stream-safe routine the
unsupervised cross-check uses, so no dependency is added and a run
reproduces. batch_correction.csv records which method ran,
what it was judged on, and why, including when correction was
refused.
Correction is applied to the shared embedding, the clustering and the gate-cluster concordance. It is not applied to per-sample frequencies, marker medians or the differential tests, which derive from per-sample thresholds and are batch-local by construction. The quantity a batch effect distorts is the single embedding computed across all samples.
11. Conformance
Every check above is internal to one run. This one is not.
The scale check (scale_outlier in
thresholds_used.csv, summarised in
threshold_scale_qc.csv) compares each threshold against the
other samples of the same panel, which identifies a single deviant tube.
It cannot identify a cohort that moved as a whole, because the
leave-one-out peer median moves with it. After a laser service, a
reagent lot change or six months of drift, every sample can agree with
its peers and disagree with the assay as it was validated.
--write-baseline records where an accepted run placed
each threshold, how variable it was, how often it needed the quantile
fallback, and what the populations came out at. --baseline
measures a later run against that record and writes
specification_conformance.csv with a verdict per marker and
per population.
The baseline holds summaries and the specification text, no event-level or patient data, so it belongs in version control beside the config it describes.
A failure is not a statement that the run is bad. It says the two
runs no longer place their cuts in the same place, so their frequencies
are not the same measurement and should not be pooled until someone has
looked. --fail-on-drift turns that verdict into an exit
code for scheduled runs, raised after every output has been written.
Cuts are compared in instrument units: each marker’s median cut is
carried back through this run’s transform and forward through the
baseline’s, because the cofactor and logicle widths are re-derived from
every run’s data and a changed ruler would otherwise read as drift. Two
results are withdrawn rather than reported: a cut whose transform cannot
be rebuilt on both sides when the transforms differ, and a redefined
population, which is a different population; both read
not comparable, which is not a small drift.
12. Provenance
run_manifest.txt records the R version, platform, the
version of every package loaded at run time, the git commit and
working-tree state where the code was a checkout, the full invocation,
and every option in force. It is written before the expensive stages and
rewritten at completion, so an interrupted run leaves
status: failed rather than an absent or misleading
record.
miflowcyt.md restates the same run against the ISAC
reporting checklist, which several journals check at submission. Its
instrument section is read from the FCS keyword block: cytometer, serial
number, acquisition software, date, operator and event counts per file,
and per panel a detector table giving $PnN,
$PnS, voltage, range and whether amplification was linear
or logarithmic. Its data-analysis section is read from the run, so it
cannot disagree with what was computed.
The two sections a run cannot establish, why the experiment was done
and what the cells and reagents were, are marked
TO BE COMPLETED. An omitted section reads as one that did
not apply. Individual keywords follow the same rule and are reported as
not recorded in the FCS file rather than dropped, since a
missing $PnV or $SPILLOVER is usually the
explanation for something further down.
--no-miflowcyt skips it.
Every output file
Reference for every file a run writes, its columns, and the flag that produces it. Worked examples of the principal figures, rendered from a run on public data, are in the Worked example; this article is the exhaustive list rather than a second copy of them.
1. Quality control
| File | Content |
|---|---|
recon_diagnostics.png |
Gate boundaries per sample |
gating_qc.png |
Thresholds superimposed on the densities they derive from |
staining_qc.csv |
Per-sample verdict and exclusion reason, the CD45+ share
of live cells and the live share of single cells
(pct_live_of_singlets, empty where no viability gate was
applied); pct_live_if_dominant_dead is the share below a
dye minimum lying under the dominant mode, the live share if that mode
is the dead cells (or empty), for a mostly dead sample the gate reads as
mostly live; a second live mode near zero, common on whole blood, also
produces one, so read it with the dye’s plot |
margin_events.csv |
Per file: margin events removed (or capped), events below a
channel’s lower limit by flowAI’s rule (counted, not removed: in
compensated data they are mostly cells bright in a spilling channel, and
removing them would bias those cells’ frequency), channels linearised
from $PnE, and the compensation applied |
thresholds_used.csv |
Threshold, derivation, cofactor and outlier status per sample and marker |
thresholds_within_parents.csv |
Cuts a population with parent: derives on its parent’s
events, beside the CD45+ cut |
threshold_scale_qc.csv |
Per panel and marker: median, range, and how many cuts are scale
outliers or fallbacks. Written when any cut is an outlier; the
per-sample robust z is in thresholds_used.csv
|
acquisition_qc.csv, .png
|
Per-sample acquisition stability, and the flagged intervals |
acquisition_qc_bins.csv |
Per-interval rate and channel departure |
acquisition_qc_impact.csv |
How far each population would move if the flagged intervals were excluded |
peacoqc_summary.csv |
Per file, the events PeacoQC removed, the share each of its checks
flagged, and a note where the isolation tree was not run (fewer than 150
time bins), written by --peacoqc
|
fmo_agreement.csv |
Derived cut against its FMO-anchored equivalent, in units of the cut’s own uncertainty |
controls_refused.csv |
Channels where a declared control could not anchor a cut, and why |
spreading_pairs.csv |
Per channel pair, how much wider the receiver’s negatives become,
overall and at a given source level, and trend_rho, a
screen for compensation or unmixing error (trend_unresolved
where spreading alone could produce the trend) |
spillover_spreading_matrix.csv |
The published spillover spreading matrix, written by
--single-stains
|
spreading_receivers.csv |
Per marker, total spreading received and whether it explains a fallback |
calibration.csv |
Bead fit per channel, written by
--calibration-beads
|
thresholds_used.csv gains override_reason
and override_by only when the config declares a
sample_overrides: block, so a run that overrides nothing
writes the table it always wrote. source is
manual for an overridden cut, fmo_q995 for one
anchored to a fluorescence-minus-one control, fmm_q995 for
a tube that leaves out several reagents at once, and
control_q995 for an unstained tube. Those three bare names
mean the data indicated no cut (no density minimum: the tail gate or
quantile it would otherwise have used is in derived_source)
and the control supplied one; the _valley_rejected suffix
means the data did indicate a cut and the control put the boundary
higher, and fmo_q995_valley_lowered, under
--fmo-sets-cut only, that a true FMO put it lower. Either
way the row carries derived_threshold and
derived_source, the cut that would have been used without
the control, so the two stay comparable.
Only the FMO is a full reference. An unstained tube and a
minus-multiple tube both lack the spreading the stained panel puts into
a channel, so their negatives are narrower than the sample’s and the
cuts they anchor are permissive on any channel that receives spreading
(Roederer 2001; Maecker & Trotter 2006).
spreading_receivers.csv names those channels; they are the
ones worth an FMO.
What a control has to be before it is used
Two things go wrong with a control-anchored cut, so each declared control channel is checked before it is trusted.
A far quantile finds the edge of the negative population only when the control contains nothing but that population. A tube carrying roughly one percent of bright events puts the 99.5th percentile inside that tail instead. On the minus-multiple data this check was written against, one channel’s control sat at 1.0 at the 95th percentile and 5.6 at the 99.5th: a cut there was above the full stain’s own 99th percentile, so nothing in any sample would have been positive. The run also places the cut by the negative mode and the spread of the half below it, which a bright tail cannot move, and takes whichever of the two is lower. For a clean control that is the quantile, so nothing changes.
A minus control must also be dimmer in the channel it leaves out.
When it is brighter, the tube, the sample sheet or the unmixing is
wrong, and anchoring to it raises the cut and deletes a real population.
Comparing the two negative modes in units of the sample’s own spread
catches that. A refused control is listed in
controls_refused.csv with its reason, and the threshold
comes from the sample’s own data as it would have without any
control.
Keep one consequence in mind when reading
fmo_agreement.csv. A cut the control supplied has no
uncertainty of its own, because the events behind it are in a different
tube, so those rows carry distance but leave
distance_in_u empty. The verdict scaled by uncertainty is
therefore available for the rows where the sample’s own cut was the one
applied, which are also the rows where the two methods were free to
disagree.
Read acquisition_qc_impact.csv against
u_pct_points for the same population before acting on an
acquisition flag. --drop-unstable-events performs the
exclusion; without it nothing is removed.
These constrain the interpretation of every subsequent file. A run whose gates are misplaced produces internally consistent statistics that are unusable.
2. Uncertainty
| File | Content |
|---|---|
threshold_uncertainty.csv |
Sampling and method components per sample and marker, their quadrature sum, the valley’s relative depth, and the fraction of resamples that found it |
uncertainty_budget.csv |
Contribution of each threshold to each population’s uncertainty, per sample |
frequency_uncertainty.png |
Per-sample frequencies with their uncertainty, one row per population |
uncertainty_budget.png |
The same budget as a stacked median contribution |
detection_limits.png |
Samples per population, split by whether the event count clears each limit |
bootstrap_valley_rate is the column to read first. A
threshold found in every resample is a population boundary; one found in
half of them is histogram noise that happened to clear the depth rule,
and the two are indistinguishable in
thresholds_used.csv.
u_combined is NA rather than zero where it
could not be computed, which happens for a threshold taken from a
separate control tube. u_n_terms_missing on the frequency
table counts how many of a population’s markers contributed nothing, so
a small total that is small only because most terms are absent is
distinguishable from a tight one.
Two uncertainties are reported per frequency and they answer
different questions. u_pct_points is placement: how far the
number moves when the cuts behind it move.
u_counting_pct_points is sufficiency: what it carries from
the number of events counted, as the Wilson half-width at one standard
deviation. u_total_pct_points is their quadrature sum. The
two are alike for an abundant population and diverge for a rare one,
where a cut through a wide gap is well determined and the count behind
it is not.
lod_pct and loq_pct place the conventional
twenty and fifty events on the percentage scale of that sample’s parent
gate, and detection says which side of them the value
falls. Both are set by what was acquired rather than by the gating
strategy, so --max-events-per-file raises them in
proportion; --lod-events and --loq-events
change the conventions themselves.
Counting is not a row in uncertainty_budget.csv. That
table answers which threshold a population’s uncertainty comes from, and
counting is not a threshold.
Written by default. --no-uncertainty skips it and
restores the previous output exactly.
3. Conformance
Written by --baseline.
| File | Content |
|---|---|
specification_conformance.csv |
Per marker: this run’s threshold against the baseline’s, scaled by the baseline’s own spread, with a verdict |
specification_conformance_populations.csv |
The same for population frequencies |
specification_changes.csv |
Populations added, removed or redefined since the baseline |
Three verdicts. pass is within tolerance,
qualify is a marker worth looking at before pooling the two
runs, fail says the cuts are no longer in the same place
and the frequencies are not the same measurement.
not comparable is a fourth value and means the
comparison was withdrawn rather than made: the transform differs from
the baseline’s, so thresholds are on different scales, or the population
was redefined, so it is a different population and a drift statistic
would be a category error.
--write-baseline writes the reference itself. It
contains summaries and the specification text, no event-level or patient
data, so it can be version-controlled beside the config it
describes.
4. Abundance
| File | Content |
|---|---|
population_frequencies.csv |
Percentage of parent per population per sample |
population_marker_mfi.csv |
Per sample, population and marker: the median intensity on the
analysis scale (median_asinh, which keeps its name under
--transform logicle and holds the logicle value there), the
same median in instrument units (mfi), and the percent
positive |
population_mfi_summary.csv |
Median fluorescence intensity per population and marker: the median over donors of each sample’s median, in instrument units with its interquartile range, overall and per study group, with the median percent positive |
population_composition.csv |
Each population’s share of the embedded cells, its defining markers,
its spread across donors, its share within each study group
(pct_<group>, summing to 100 down each group), the
same cells as a share of all embedded cells
(pct_of_embedded_<group>, summing across a row to the
population’s share), and the percent of it positive for each marker
(pct_pos_<marker>) |
population_composition_by_timepoint.csv |
The same table for each timepoint, in the pooled table’s row order |
functional_markers.csv |
The same restricted to functional marker blocks declared in the config |
population_ratios.csv |
Derived ratios where declared |
gate_counts.csv |
Event counts at each level of the gate hierarchy |
population_frequencies.png |
Pooled composition across samples |
population_marker_heatmap.png |
Marker intensity against declared populations, z-scored |
population_mfi_heatmap.png |
MFI per population and marker, the value printed in each tile, colour scaled per marker; a bar per row gives the population’s share |
population_mfi_dotplot.png |
Dot size is the percent positive, colour the scaled MFI |
population_mfi_heatmap_by_group.png |
The MFI heatmap per study group, on one colour scale |
umap_composition.png |
The shared UMAP with a legend of each population’s defining markers, share of the embedded cells and that share split by study group with a total row, and a grid of the cells of each population positive for each marker. Every number is a percent of all embedded cells, so a row’s group columns sum to its share and no marker tile exceeds it |
umap_composition_<timepoint>.png |
The same figure for each visit, on the pooled map’s axes and in its row order |
count is an event count and scales with acquisition
duration. It is not an abundance. Report pct_of_cd45_pos
unless absolute counts were supplied through
--absolute-counts.
MFI is a median of medians, in instrument units.
Each sample’s median comes first and the cohort value is the median of
those, so donors are the replicates and the donor with the most events
does not set the value. The median is taken on the analysis scale and
inverted through the run’s transform; a median commutes with a monotone
transform, so mfi is the median on the instrument’s linear
scale exactly. Compare mfi between runs only when the
instrument settings match: it is in the instrument’s units, which a
voltage change rescales. The heatmap colours each marker separately,
between its 1st and 99th percentile across populations, so the colour
says “bright for this marker” and the printed number says how
bright.
Composition shares sum to 100; frequencies do not.
In population_composition.csv and
umap_composition.png each embedded cell has one label, its
most specific population, so “CD3 pos” holds only the CD3+ cells no
deeper population claimed. population_frequencies.csv
scores overlapping gates, where “CD3 pos” includes the CD4 and CD8 T
cells. The shares are of the embedded cells, which are drawn per sample;
pct_median_per_sample is the per-donor view. Under
--subsample rare the shares are weighted back to the true
composition.
5. Embedding
| File | Content |
|---|---|
cells_umap.csv |
Per-cell coordinates with sample, population and panel |
umap_overview.png |
Embedding by population and by sample |
umap_markers.png |
One panel per marker |
umap_density.png |
Cell density in embedding space |
umap_density_by_group.png |
The same, faceted by study group |
umap_overview_by_group.png |
Combined embedding with one column per group |
marker_umaps_by_group/ |
Full-size UMAPs per marker, in its own folder.
umap_CD3.png pools every sample, and
umap_CD3_by_<category>.png is written beside it for
every category present, not only the
--group-column one. Numeric columns, identifiers and
single-level columns are not faceted; past four categories the extras
are named in the log |
umap_multigraph_overlay.png |
Per-compartment marker distributions against the reference group |
umap.model, umap.model.meta.rds
|
Persisted model, written by --save-umap-model
|
A persisted model permits projection of subsequent batches into the same coordinate space, holding cluster positions fixed between runs. Projection is refused where the new data lack markers the model used, since zero-filling would produce coordinates that are geometrically valid and biologically meaningless.
6. Inference
| File | Content |
|---|---|
group_comparison_stats.csv |
Abundance between groups, per population |
group_differences.png |
Every population on one pair of axes: the effect against the evidence. The shortlist – read this to decide which panel below to read carefully |
group_comparison.png |
The same as per-sample distributions, one panel per population |
marker_state_stats.csv |
Differential state per population and marker |
marker_state.png |
The same as per-sample distributions |
functional_markers_stats.csv |
Functional blocks between groups |
population_ratios_stats.csv |
Declared ratios between groups |
compositional_clr_stats.csv |
Abundance tests on centred log-ratios |
compositional_concordance.csv |
Classification of each result against both parameterisations |
edger_abundance_stats.csv |
edgeR count-model test of each population’s cell counts, each group
against the reference, written by --edger
|
paired_comparison_stats.csv |
Paired designs, written by --paired-column
|
covariate_adjusted_stats.csv |
Rank ANCOVA, written by --rank-ancova
|
subcluster_marker_shifts.csv |
Pooled-event marker shifts per compartment |
design_feasibility.csv |
Which group comparisons can be made, and why the rest cannot |
parametric_tests.csv |
The t-test or ANOVA equivalent, with its assumptions recorded |
posthoc_tests.csv |
Pairwise comparisons by three methods, for three or more groups |
Every file above except the last three uses one value per sample.
subcluster_marker_shifts.csv operates on pooled events,
carries effect sizes without p-values, and answers a different question
from the tests above it.
group_differences.png
One point per population: Cliff’s delta on the x-axis, -log10 p on the y. A fold change of medians is the conventional x-axis and is the wrong one here, it is unbounded, and at single-digit group sizes it is decided by whichever sample sits at the median, so a population whose reference median is near zero produces a fold change of 40 that means nothing. Cliff’s delta is bounded [-1, 1], is the effect size the rank test corresponds to, and reads directly: 0.5 means the comparison group was higher in three quarters of the cross-sample pairs.
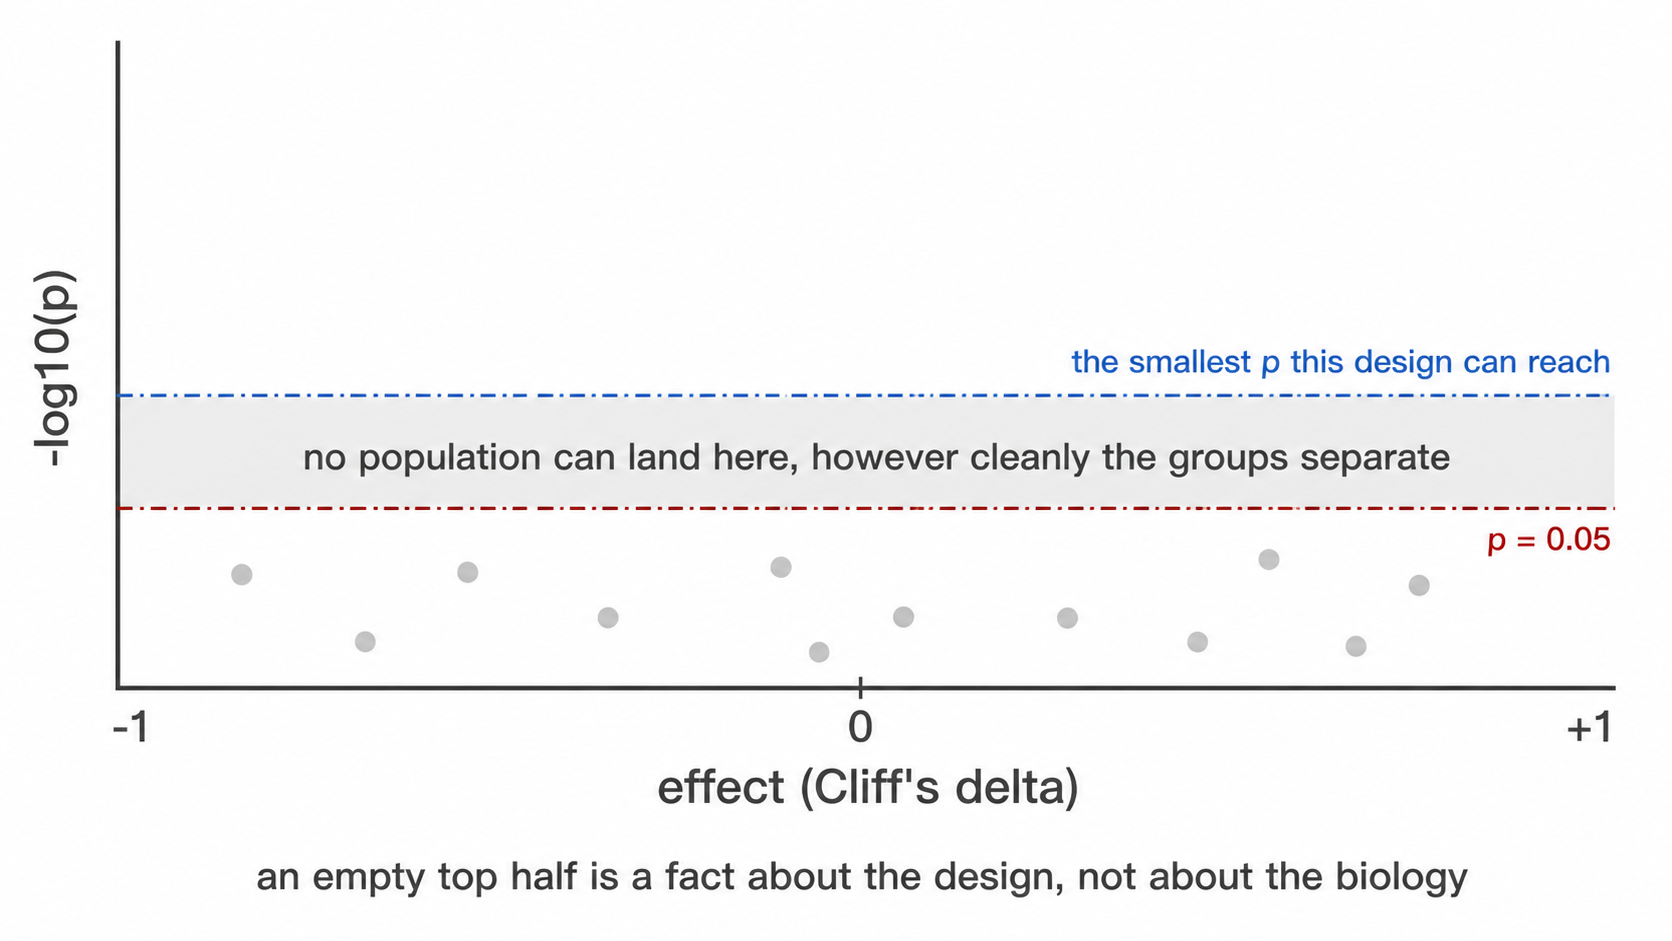
Two horizontal lines. The dashed red one is p = 0.05. The dot-dash
blue one is the smallest p this design can produce at
all: a Wilcoxon rank-sum test has
choose(n1 + n2, n1) equally likely rank arrangements under
the null, so the most extreme possible separation gives a two-sided p of
2 / choose(n1 + n2, n1) and nothing below it is reachable.
At 4 against 5 that floor is 0.016, and after correcting across a dozen
populations no population can reach 0.05 however cleanly the groups
separate. When the blue line sits above the red one, an empty
upper region of the figure says nothing about biology, it is a property
of the design, and the figure says so rather than leaving the reader to
work it out.
The floor is drawn per comparison, not once for the figure: each comparison group has its own size and so its own minimum, and 3 against 6 stops at 0.024 where 6 against 6 reaches 0.0022. With three or more groups the figure facets by comparison and each panel carries its own line.
design_feasibility.csv
Read before any of the tests. One row per group, carrying
n_samples, n_donors,
will_be_tested, valid_unpaired and a
reason.
Two failures it is there to catch. A group smaller than
--min-group-n is skipped, and a skipped comparison looks
exactly like a comparison that ran and found nothing, because both
produce no row. And a donor contributing to more than one group, which
happens whenever the group column is a timepoint, makes an unpaired test
treat repeated measures on one person as independent observations. That
second one is the dangerous case, because the test runs and its output
is well formed. will_be_tested says what the run did;
valid_unpaired says whether it should have.
parametric_tests.csv and
posthoc_tests.csv
The rank tests remain the primary result. These hold the parametric
equivalents most immunology papers report, computed on the logit of each
percentage (on log concentrations where the abundance is cells/µL),
which stabilises the variance of proportion data. The
transform column records which.
Two groups give Welch’s t-test with Student’s alongside it and
Cohen’s d. Three or more give Welch’s ANOVA with the classical
one-way alongside it and eta squared. posthoc_tests.csv
then carries Games-Howell, Tukey HSD and Dunn for every pair. Their
p_value differs in kind: Tukey HSD and Games-Howell refer
to the studentized range and are already adjusted over the population’s
pairs, Dunn’s is the unadjusted pairwise p
(p_value_adjusted_over_pairs says which).
p_adjusted_BH applies Benjamini-Hochberg within each test
across every population and pair.
Every row records shapiro_p and
brown_forsythe_p with the derived
residuals_normal, equal_variance and
assumptions_met. Where assumptions_met is
FALSE the rank test is the defensible one, and the
recommended column says which test to read. Normality is
tested on the within-group residuals, not the pooled values, because
pooled values are bimodal whenever the groups differ.
Disable with --no-parametric.
7. Diagnostics
| File | Content |
|---|---|
threshold_drift_stats.csv,
threshold_drift.png
|
Whether thresholds separate by group |
confounding_diagnostics.csv |
Covariate imbalance, outcome association, and verdict |
batch_mixing_stats.csv |
iLISI against a permutation null |
batch_group_confounding.csv |
Cramér’s V and correction verdict |
batch_diagnostic.png |
Observed against null mixing |
populations_by_batch.png |
Every population’s abundance per acquisition batch, one box per
batch and a point per sample. batch_diagnostic.png asks
whether the embedding separates by batch; this asks whether the
reported numbers do, which is the question that decides whether
a group difference might be an acquisition difference |
Clinical variables, written by --clinical-columns
A severity score, a laboratory value or an outcome flag is neither
the study group nor a confounder. A confounder is screened to decide
whether a group difference can be believed; a clinical variable is the
question. Name any sheet column with --clinical-columns, or
samples: clinical_columns: in the config , and it is
associated with every population and every marker.
| File | Content |
|---|---|
clinical_variables_correlation.png |
The clinical variables against each other. Read this first, see below |
clinical_association.csv |
One row per population × variable: test, n, the effect with its
bootstrap interval, raw and BH-adjusted p, the levels or range tested,
and an underpowered flag |
clinical_association.png |
Heatmap of the signed effect, populations against variables, with
* on the tiles that survive correction |
clinical_landscape.png |
The whole cohort as one picture: one column per sample ordered by the first numeric variable, every clinical variable as a strip above, every population as a z-scored row below |
clinical_effects_<variable>.png |
Every population’s effect against that variable, ordered, with a 95% percentile bootstrap interval on each |
clinical_<variable>.png |
The data behind one column of the heatmap: a scatter against a numeric variable, a box plot against a categorical one, one point per sample and one panel per population. Where a categorical variable’s labels are too long to fit under the panels, such as organism names, each category gets a colour and is named once in a legend, with its sample count |
clinical_association_markers.csv,
clinical_association_markers.png
|
The same against each population’s median marker intensity, one test
per population and marker (the pairs in
functional_markers.csv) |
population_trajectories.png |
Written by --paired-column with
--condition-column, and coloured by the first two-level
clinical column when there is one: per-patient lines across the
conditions with the median over them |
The test follows the variable’s type rather than being chosen: Spearman’s rho for a numeric column, Wilcoxon rank-sum with Cliff’s delta for a two-level column, Kruskal-Wallis with epsilon-squared for more levels. Rank methods throughout, for the reason they are used everywhere else here, clinical scores are ordinal by construction, laboratory values are skewed with outliers that are real rather than erroneous, and cohorts are small.
Epsilon-squared is H / (n - 1), the proportion of rank
variance the grouping accounts for. It is unsigned: a
variable with three levels has a magnitude but no single direction,
which is why the signed column exists and why those tiles
stay grey on the heatmap rather than being coloured as though they
pointed somewhere.
The effect, its interval, and why they come before the p-value
ci_low and ci_high are a 95% percentile
bootstrap interval on the effect, 2000 resamples of the patient-value
pairs for Spearman, stratified within each arm for Cliff’s delta, from a
fixed seed so the same table always yields the same interval.
clinical_effects_<variable>.png draws them ordered by
effect.
On ten patients most intervals span zero, and that is the finding: a rho of 0.61 whose interval runs -0.1 to 0.9 is a lead worth powering a follow-up on, not a result. The interval is itself approximate at this size, below about nine observations the bootstrap’s effective resample is smaller than the nominal one and coverage falls short of 95%, so read a wide interval as this cohort does not constrain the effect rather than as a precise range. It is suppressed entirely below six samples rather than quoted at a width nobody should trust.
Read the variables against each other first
Benjamini-Hochberg is applied within each variable, which treats the
variables as separate questions. That holds only when they carry
different information. A cohort where the sickest patients are also the
ones who died has one gradient and two columns
describing it, and an association found against both is one finding
reported twice. clinical_variables_correlation.png is where
that is visible: circle area is the absolute Spearman coefficient, fill
is its sign, and the number is printed where the unadjusted p-value is
below 0.05. Two-level variables are included coded 0/1, for which
Spearman is the point-biserial correlation of the ranks (not the
rank-biserial: two perfectly separated groups of five give 0.87, not 1);
variables with three or more unordered levels are excluded and named in
the caption, because there is no ordering to correlate and coding them
1/2/3 would invent one.
Benjamini-Hochberg is applied within each variable, across the populations tested against it, because each variable is its own question asked of every population. Pooling across variables would penalise a well-powered variable for the company it keeps.
Two things this is not. It is not survival analysis: a 28-day flag is tested as the two-group comparison it is, and no time-to-event model is fitted because the sheet carries no follow-up time. And it is not a claim about cells: every test runs on one value per sample, so the replicates are subjects. Correlating a score against tens of thousands of events would treat one deeply acquired patient as tens of thousands of observations.
Read the effect before the asterisk. On a small cohort these tests
detect only very large effects, so a null result says little, and the
underpowered column marks every test run on fewer than ten
samples. | marker_batch_drift.csv | Earth Mover’s distance
between batches per marker, in analysis units and scaled by the marker’s
own MAD | | threshold_batch_drift.csv | The threshold test
above, grouped by batch instead of by study group | |
batch_correction.csv | Whether a correction ran, which
method fitted it, the Cramér’s V it was judged on, and the
reason. Written whenever --correct-batch is set, including
on a refusal |
The last two are written by --batch-column and answer
the question the first three cannot: which channel moved. iLISI is a
property of the embedding, so a flagged run names nothing actionable,
whereas a flagged marker names a reagent lot or a detector.
Read emd_over_mad rather than emd_max: the
raw distance is in the units of whichever marker it describes, and
dividing by that marker’s own spread is what makes two of them
comparable. worst_pair names the batches responsible.
Both tables are needed. A threshold is one number per sample and registers only drift that moves the cut, while a marker can change its spread or lose the separation between its modes with the density minimum between them unmoved.
| File | Content |
|---|---|
run_manifest.txt |
Versions, commit, invocation, options |
8. Clustering
Written under --cluster and
--explain-clusters.
| File | Content |
|---|---|
unsupervised_clusters.csv, .png
|
Cluster assignment per cell |
cluster_gate_agreement_clusters.csv |
Dominant label and purity per cluster |
cluster_gate_agreement_populations.csv |
Recovery of each declared population |
subcluster_k_selection.csv |
Silhouette-selected k, from --auto-subcluster-k
|
cluster_gate_proposals.csv |
Learned gate geometry with held-out metrics |
cluster_gate_polygons.csv |
Polygon vertices in transformed units |
cluster_gate_strategy_<k>.png |
One figure per explained cluster |
9. External labels
Written by --external-labels, and by
--export-gates for the last two.
| File | Content |
|---|---|
external_label_gates.csv |
Learned strategy per supplied label, with held-out metrics at each depth |
external_label_polygons.csv |
Polygon vertices on the analysis scale |
gate_transferability.csv |
Precision, recall and F1 on each donor, from a strategy refitted without that donor |
gate_transferability_summary.csv |
Minimum, median, maximum and IQR of F1 across donors |
external_label_strategy_<label>.png |
One figure per label |
*.gatingml.xml |
ISAC Gating-ML 2.0, linear units, levels chained parent to child |
*_polygons_linear.csv |
The same vertices as a table, for redrawing by hand |
Read f1_min from the summary, not
f1_median. A gate scoring 0.9 on every donor and a gate
scoring 1.0 on nine donors and 0.1 on one have the same median and are
not the same gate.
The Gating-ML vertices are subdivided along each edge. An edge that
is straight on the analysis scale is a curve in the linear units the FCS
file stores, so a polygon built from the corners alone would describe a
different region from the one that was fitted and validated. Dimensions
are named by marker symbol, which is what cyRAVEN resolves from
$PnS.
10. Auxiliary
| File | Content |
|---|---|
run_manifest.txt |
R and package versions, git commit, invocation, options, run status |
miflowcyt.md |
The same run against the ISAC reporting checklist |
report.html |
Every output above embedded in one self-contained file, in the order this documentation says to read them. Written for failed runs too, with a diagnosis |
patient_metadata_english.csv |
Patient table after column mapping and value translation |
absolute_counts.csv,
absolute_counts.png
|
Measured cells per microlitre per sample and population, written by
--absolute-counts
|
absolute_counts_raw.csv |
The supplied workbook flattened to CSV exactly as read, before any
header or population-name interpretation. Open this first when a
population from --absolute-counts looks wrong: it separates
a reading problem from a mapping one |
absolute_counts_stats.csv |
Between-group tests on the measured counts, on
cells_per_ul. Written when the run performs group tests, so
it needs --group-column and is absent under
--no-group-tests
|
absolute_counts_qc.png |
The supplied counts, one log-scale tile per sample and population, controls and QC failures labelled, same flag. Written unconditionally whenever counts are supplied, and deliberately before the group-comparison figure, because a unit or mapping error has to be visible before the more inviting figure is read as a finding |
populations_unavailable.csv |
One row per sample and population the panel cannot score, with the reason. Written only when there is at least one |
flowjo/ |
UMAP-annotated FCS, written by --flowjo-export
|
config_derived.yaml |
Derived parameters, written by --write-config
|
sample_map_template.csv |
Written by --write-sample-map
|
gate_adjustments.csv |
One row per hierarchy gate --auto-fix-gates skipped and
per population cut it replaced, with threshold_not_applied,
pct_of_parent_kept and the reason. Empty without the
flag |
Gate adjustments
Written only under --auto-fix-gates, and the one table
to read before any frequency from a run that used it, because a skipped
gate changes every count beneath it.
| Column | Meaning |
|---|---|
sample_id, gate, marker
|
Which cut, in which sample |
threshold_source |
Why it was eligible. quantile_fallback means no density
minimum was found, so the cut came from a percentile |
threshold_not_applied |
The number that would have been used. Kept so the decision is auditable rather than merely reported |
action |
skipped, with the parent carried through unchanged; for
a population cut, replaced by and the new value |
pct_of_parent_kept |
What the gate retains after the decision. 100 when it was skipped |
reason |
The rule that fired, in words |
Two rules put a gate here. A threshold that came from
quantile_fallback has its retention fixed by the fallback
constant rather than by the data, so it keeps the same share of the
parent whatever the sample holds. And a gate retaining less than 5% of
its parent is misplaced whatever its source says, because a viability or
CD45 gate that discards nineteen cells in twenty is not measuring what
it claims to.
Population markers are never skipped: a quantile fallback on CD19 is
a poor threshold, but “no threshold” does not mean “every cell is a B
cell”. They borrow instead (--peer-cuts, which
--auto-fix-gates implies). Every sample of a panel is on
one pooled transform, so where most of them found a density minimum for
the marker, the median of those minima is a measured cut on this
sample’s scale too, and a sample without one – a
quantile_fallback or a tail-rule cut – takes it. Where most
samples found none, as for a rare marker, the tail rule stands, and only
a fallback or a tail cut more than 3.5 robust SDs from the other
samples’ cuts takes their median. The row in
thresholds_used.csv then has source
peer_median, keeps needs_review, and holds the
original cut in derived_threshold. The same applies to the
functional-block markers, whose positive fractions use these cuts. Cuts
from a control, a config entry or a manual override are never
replaced.
10d. Externally measured cell counts
Written by --total-counts. A share is constrained to sum
to 100, so a frequency table cannot distinguish one population expanding
from every other contracting. A measured yield per acquisition is what
separates the two.
| File | Content |
|---|---|
total_counts.csv |
The yields as parsed and matched: patient_raw,
timepoint, total_cells,
sample_id. One row per acquisition that matched |
total_counts_raw.csv |
The sheet flattened exactly as read, before any header or block interpretation. Open this first when a number looks wrong: it separates a reading problem from a matching one |
total_counts_qc.png |
Read this before anything derived from it. The yields on a log axis. Everything downstream inherits their error, and a yield in the wrong unit lands decades off the median here while staying invisible in the derived table |
absolute_vs_share.png |
The two measures side by side per population. Where a global depletion is visible as the thing a share cannot express |
absolute_vs_share_by_timepoint.png |
The same, once per visit, under
--split-by-timepoint
|
explore_total_counts_qc.png,
explore_absolute_vs_share.png
|
The twins of those two inside explore/
|
explore_cluster_stats_absolute.csv |
Inside explore/: the donor-level cluster tests on cells
per cluster, kept apart from the share tests in
explore_cluster_stats.csv
|
explore_cluster_count_concordance.csv |
Inside explore/: per cluster, whether the two agree.
absolute only is a compartment that changed size with its
composition unchanged; share only is a redistribution |
population_frequencies.csv gains
total_cells, cells_absolute and
count_basis; where the sheet carries
blood_volume_ml it gains cells_per_ml as well,
which is the column to read across timepoints because the draws differ
in volume.
count_basis records the route on every row that carries
one. Treat cells_absolute as
dual-platform: one measurement from this run multiplied
by one from an instrument it never saw. Published interlaboratory CVs
for that route are roughly 20-33%, against 10-16% for single-platform
bead counting, so a difference smaller than that is unresolved. Shares
are never overwritten.
10e. Clinical variables
Written by --clinical-columns. One figure per variable,
plus the effects across populations.
| File | Content |
|---|---|
clinical_<variable>.png |
One figure per variable named to the flag, showing the association with every population |
clinical_effects_<variable>.png |
The effect sizes for that variable with their bootstrap intervals, populations ordered by effect |
clinical_association.csv |
Every variable against every population: the test chosen from the
column’s type, estimate, effect,
ci_low, ci_high, p_value,
p_adj_BH, and underpowered
|
clinical_association_markers.csv,
.png
|
The same against marker expression within each population rather than abundance |
clinical_variables_correlation.png |
Read this first. p-values are adjusted within each variable on the assumption that the variables are separate questions, and this is where you see whether they are |
clinical_landscape.png |
Every clinical variable and population on one grid, columns ordered by timepoint then study group |
clinical_timepoint.png,
clinical_infection_focus.png
|
A categorical clinical column gets the same treatment as a numeric one, with the test following the type |
n_patients and repeated_measures on every
row say what the test actually had: a variable that is a property of the
donor is tested at the donor level even when several acquisitions carry
it, because the unit of replication is the donor.
10f. The figure set per visit
Written by --split-by-timepoint into
by_timepoint/<level>/, plus the paired views that
need every visit at once and so stay in the run directory.
| File | Content |
|---|---|
by_timepoint/<level>/ |
The whole figure set again, restricted to that visit |
timepoint_trajectories_pct_of_cd45_pos.png |
One line per patient across visits, on share |
timepoint_trajectories_cells_absolute.png |
The same on absolute cell number, with
--total-counts
|
timepoint_trajectories_cells_per_ml.png |
The same per millilitre, where blood_volume_ml is
supplied. This is the one to read across visits, because the draws
differ in volume |
timepoint_subset_balance.png |
Subset composition by visit |
timepoint_marker_intensity.png |
Marker expression by visit |
functional_markers_by_timepoint.png,
population_ratios_by_timepoint.png
|
Per-visit twins of the pooled figures. The ratio figure shows only the ratios the config declares |
population_ratios_by_cell_type_by_timepoint.png |
Every population as a share of CD45+, one panel per cell type, visits on the x axis. No test is drawn, because the visits are the same patients |
umap_markers_<level>.png |
The marker grid restricted to one visit, on the same embedding |
The embedding, the thresholds and the statistics are not recomputed per visit: only the rows drawn are restricted, so a position on one visit’s UMAP is the same position on another’s and a threshold is the same cut.
10g. What explore writes back
| File | Content |
|---|---|
explore_cluster_identity.csv, .png
|
Which declared population each cluster corresponds to, scored by F1
with precision and recall beside it, plus
pct_catch_all and a call
|
explore_cluster_subsets.csv |
The immune subset each cluster’s own marker profile matches, with the markers that decided it and the margin over the runner-up |
explore_cluster_median_heatmap.png |
Scaled median expression per cluster, the direct equivalent of what a tool with no gating step produces |
spec_gaps.csv |
Under --maybe-learn: what the specification does not
cover, one row per issue with subject, detail
and action
|
suggested_config_next_run.yaml |
The declared specification plus a draft entry per uncovered cluster, in runnable config format. A draft: the names are placeholders and nothing in the run that writes it uses it |
The --absolute-counts input
A frequency is a proportion of a parent gate, so it moves when any other population moves. An absolute concentration does not, which is why bead-based or volumetric counts are worth carrying through the run when the laboratory measured them.
The flag takes a CSV or Excel sheet laid out as the counting instrument exports it: the first row is a header, the first column identifies the sample, and every further column whose header is non-empty and whose body is numeric is read as a population. Blank rows are skipped, so cohort separators do not need removing.
sample,Granulocytes,Monocytes,Lymphocytes
HC-13;2.fcs,3810,420,1650
HC-14;1.fcs,2990,395,1880
Units come from any header cell that is not itself a population
column. A label containing microlitre, uL or
µL is read as cells per microlitre; one containing
mL or millilitre is converted by dividing by 1000. When no
unit label is present the values are assumed to be cells per microlitre
already and the log says so; verify that before trusting the figure.
Each row is matched to a sample_id by
patient_id first and then by acquisition filename, both
insensitive to case, surrounding whitespace, a .fcs
extension and a trailing copy. The filename match is a
suffix match with a delimiter required immediately before it, because
export sheets routinely omit the batch prefix the acquisition filename
carries. A key matching more than one file is treated as no match rather
than guessed at, and every unmatched row is named in the log.
--absolute-counts needs --sample-map, since
that is where the join key lives.
miflowcyt.md completes the two checklist sections a run
can establish. The instrument section comes from the FCS keyword block:
cytometer, serial, acquisition software, date, operator and event counts
per file, then one detector table per panel with $PnN,
$PnS, voltage, range and amplification mode. The
data-analysis section comes from the run, so the compensation statement,
the transform and its parameters, the gate hierarchy, the population
specification and the tally of how the thresholds were obtained all
describe what was actually computed.
Experiment intent and specimen biology are marked
TO BE COMPLETED, and a keyword the file does not carry is
written as not recorded in the FCS file rather than
dropped. Both follow the same rule: an absent line reads as a line that
did not apply, and neither of those is true here.
report.html
The reading order made navigable, and the one file worth sending to someone else. Each section states what it reports and how to read the outputs under it, and a run that excluded samples says so above every result.
It is self-contained. Every figure is embedded at
full resolution and every table in full, so it can be moved, attached to
an email or archived on its own; it references no other file, loads no
font or script from a network, and works from a file://
path. A report whose images live beside it becomes a page of broken
icons the moment it is moved, and a result that cannot survive being
moved is not a record.
| Feature | Behaviour |
|---|---|
| Numbering | Every section is numbered in reading order, and every figure and table within it (4.1, 4.2, …), on its tab, caption and contents entry. Numbers are assigned after the sections a run did not write are dropped, so they have no gaps |
| Search | A bar pinned to the top finds sections, figures and tables by title,
name, description and column name, and tables by the values in their
rows; a row match opens the table already filtered. / or
Ctrl+K focuses it, arrow keys move, Enter opens |
| Sections | Collapsible, with a sidebar indexing every section, figure and table, and expand/collapse-all |
| Sidebar | Drag its right edge to resize, or focus it and use the arrow keys. The width is remembered for next time |
| Back to top | A button at the bottom right once you are a screen down, since the report runs to tens of screens |
| Figures | Uniform display box whatever the native aspect ratio, with a
one-line description underneath; click to zoom, with keyboard
+/- and Escape; download the original PNG at
full resolution. A figure is decoded only when its tab is shown |
| Small screens | Below 900px the contents list becomes a drawer behind the button in the search bar, and figures and table controls fit the width |
| Tables | Searchable across all columns, sortable by clicking a heading, shown 10, 50, 100 or all rows, scrollable with a sticky header |
| Export | Any table exports to CSV exactly as filtered and sorted, so what you export is what you were looking at |
| Completeness | Every figure and table the run wrote appears; anything no section names is collected under “Further outputs” rather than omitted |
Its size is the sum of the figures it carries, once each: tens of
megabytes on a full run (59 MB for one 24-sample cohort with 108
figures, which was 108 MB while each figure was stored twice). Opening
it costs less than its size suggests, because no figure is decoded until
it is shown. --report-images link writes a report of a few
megabytes that references the PNGs beside it instead of carrying them;
it opens at once but shows its figures only while it stays in the
results directory, and its tables are still embedded. A table larger
than 8 MB is named with its row count instead of being embedded, which
in practice means only the per-cell exports; the limit is
options(cyRAVEN.report_table_max_mb = ).
A run that fails writes it too. The diagnosis comes
first: the error, the stage the run reached, the log leading up to it,
what the message means for the data rather than for R, and the next
action. Everything produced before the failure is embedded below,
because that partial output is usually where the evidence is. A
gating_qc.png written before the failure often shows the
cause directly.
--no-miflowcyt and --no-report skip those
two. --write-config, --write-samples and
--write-sample-map terminate after writing and cannot be
combined with a full run, and --check validates the inputs
and exits without writing anything.
The FlowJo export writes one pooled file, one per sample and one per
group. Open _ALL_SAMPLES.fcs, plot UMAP-1 against UMAP-2,
and decode the Population, SampleID and CohortID parameters using
population_codes.csv.
10a. The statistics catalogue
Written on every run, grouped or not.
| File | Content |
|---|---|
statistical_methods.csv |
Every commonly reported method in the immunophenotyping and cytometry literature, whether this run computed it, and why |
normality_tests.csv |
Shapiro-Wilk per population per group, and Brown-Forsythe for equal variances across groups |
These exist because a reader arriving from a paper that reports
t-tests and ANOVA finds rank tests here instead.
statistical_methods.csv names Student’s and Welch’s
t, one-way and two-way ANOVA with Tukey, repeated measures,
Mann-Whitney, Kruskal-Wallis with Dunn, chi-squared, Bonferroni and the
diffcyt family, and states what was done about each.
normality_tests.csv is the evidence for that choice.
Read its interpretation column rather than
shapiro_p alone: Shapiro-Wilk on 4 to 10 donors has almost
no power, so a non-significant result is not evidence
of normality, and the column says so. That is why the rank test is
used.
What does not happen is running every test and reporting all the p-values. At these group sizes, choosing among six p-values per population is p-hacking with extra steps.
10b. explore/: unsupervised discovery
Written only under --explore or
--explore-only, and only into this subdirectory. Nothing
outside it changes.
| File | Content |
|---|---|
explore_report.html |
Self-contained report, separate from report.html,
numbered and searchable in the same way |
explore_cluster_profile.csv |
Per cluster: size, phenotype string, fraction positive and median per channel |
explore_cluster_mfi.csv |
MFI per cluster and marker: median over donors of each sample’s cluster median, in instrument units with its interquartile range, overall and per group |
explore_cluster_composition.csv |
Each cluster’s share of the cells after the QC gate, with its phenotype, matched subset, spread across donors and share per group |
explore_umap_composition.png |
The explore embedding with a legend of each cluster’s subset, phenotype and share |
explore_cluster_mfi_heatmap.png,
explore_cluster_mfi_dotplot.png
|
The cluster MFI as a value-printed heatmap and as a dot plot, as for declared populations |
explore_qc_clusters.csv |
The cluster-level gate: call and the basis
for it |
explore_cluster_abundance.csv |
Per donor per cluster, with counting uncertainty and LOD/LOQ |
explore_cluster_stats.csv |
Donor-level group tests, carrying the batch/group confounding verdict |
explore_cells.csv |
One row per cell: sample, event index, cluster, UMAP coordinates |
explore_vs_populations.csv |
Cross-tab against the declared labels |
explore_cluster_identity.csv |
Per cluster: the declared population it best corresponds to, the precision and recall behind that match and their harmonic mean (F1), the runner-up, and the share of the cluster that is the catch-all. A cluster at or above 70% catch-all is reported as undescribed |
explore_cluster_subsets.csv |
Per cluster: the immune subset its own marker profile matches, the requirements checked, and the margin – the smallest distance from the positivity cut across them. Written whether or not a specification was scored |
explore_findings.csv |
Clusters no declared population covers |
explore_population_split.csv |
Declared labels spanning several clusters |
explore_suggested_spec.yaml |
A draft specification, for curation |
explore_provenance.csv |
Every choice explore made, and on what basis |
Figures: explore_cluster_identity.png,
explore_umap_clusters.png,
explore_cluster_heatmap.png,
explore_cluster_median_heatmap.png,
explore_umap_by_group.png,
explore_umap_markers.png, and
explore_marker_umaps_by_group/.
explore_cluster_identity.png is the one to read first:
clusters as rows, declared populations as columns, grouped by the
population each cluster best matches, with the subset its marker profile
matches in the row label. The match is scored by F1 rather than by the
largest overlap, because a cluster holding 300 of a run’s 6,000 CD4 T
cells has CD4 as its plurality while accounting for almost none of that
population. See Explore
mode.
The last four tables appear only when a specification was scored
and --maybe-learn is set. Without that
flag the two analyses are computed in isolation and neither sees the
other; see Explore
mode.
spec_gaps.csv is the one file explore may add to the run
directory itself, and only under --maybe-learn. It names
declared populations spanning several clusters and clusters no
population covers.
10c. by_timepoint/: the figure set per visit
Written under --split-by-timepoint, when the sample
sheet carries a timepoint column with two or more levels of
at least two samples each. One subdirectory per level, each holding the
same figures the pooled run writes, drawn over that visit’s samples
alone.
| File | Content |
|---|---|
by_timepoint/<level>/population_frequencies.png |
Abundance, that visit only |
by_timepoint/<level>/population_marker_heatmap.png |
Phenotype check, that visit only |
by_timepoint/<level>/marker_state.png |
Positivity per population, that visit only |
by_timepoint/<level>/umap_overview.png |
The shared embedding, that visit’s cells |
by_timepoint/<level>/umap_markers.png |
Marker grid on the shared embedding |
by_timepoint/<level>/umap_density.png |
Density per sample |
by_timepoint/<level>/functional_markers.png |
Functional blocks, that visit only |
by_timepoint/<level>/population_ratios.png |
Declared ratios, that visit only |
by_timepoint/<level>/absolute_vs_share.png |
Written when an external total was supplied |
by_timepoint/<level>/frequency_uncertainty.png,
detection_limits.png
|
Counting uncertainty, that visit only |
The embedding, the thresholds and the statistics are not recomputed per visit. Only the rows drawn are restricted. A position on one visit’s UMAP is therefore the same position on another’s, and a threshold is the same cut. A difference between two of these directories is a difference in the cells, not in the method. Re-running the pipeline per visit would instead produce embeddings computed from different cells, between which no position is comparable, and re-derive the thresholds, making “CD4-positive” a different predicate at each visit.
No test is annotated on these figures. Splitting the cohort by visit and again by study group leaves too few samples per comparison, and a bracket computed on the pooled cohort drawn beside one visit’s data would attribute a cohort-level result to a subset of it.
The paired views (timepoint_trajectories_*.png,
timepoint_subset_balance.png,
timepoint_marker_intensity.png) stay in the run directory
and are written whether or not the flag is set. They need every visit at
once, so splitting them by visit is what destroys them.
Statistics
Every test here trades assumptions against power. This article states which trade was made at each point, and the sample size at which it should be revisited.
1. Aggregation
1.1 Pseudoreplication
The event count in an FCS file is determined by acquisition duration, not by study design. Treating events as independent observations sets the degrees of freedom from an operational parameter: sixteen donors contributing one million events each yield a nominal n of 1.6 × 10⁷.
Two consequences follow. Statistical power becomes a function of instrument time, so extending acquisition on one tube increases apparent significance. More seriously, a single donor acquired to greater depth contributes disproportionate weight, and inter-individual variation in that donor is indistinguishable from a group effect.
1.2 Implementation
Every test aggregates to one value per sample per population before estimation, following Weber et al. (2019, Commun Biol 2:183). The degrees of freedom reflect the number of donors.
ids <- sprintf("S%02d", 1:12)
mfi <- expand.grid(
  sample_id = ids,
  population = "CD4 T cells",
  marker = "HLA-DR",
  stringsAsFactors = FALSE)
mfi$n_cells <- 500
mfi$median_asinh <- rnorm(12, 2, 0.3) +
  rep(c(0, 0.8), each = 6)
mfi$pct_positive <- pmin(100, pmax(0,
  rnorm(12, 30, 5) +
    rep(c(0, 10), each = 6)))
mfi$is_control <- FALSE
mfi$qc_status <- "pass"
grp <- setNames(
  rep(c("HC", "Patient"), each = 6), ids)

res <- stats_marker_state(
  mfi, grp, reference = "HC")
res[, c("marker", "measure", "n_reference",
        "n_comparison", "delta_median",
        "p_value")]
#> marker measure n_reference
#> 1 HLA-DR median_asinh 6
#> 2 HLA-DR pct_positive 6
#> n_comparison delta_median p_value
#> 1 6 1.025903 0.002164502
#> 2 6 13.592904 0.008658009n_reference is 6, the number of control donors, not
3,000, the number of events they contributed.
Event-level quantities remain available through
stats_subcluster_shifts(), which reports effect sizes
without p-values. They are hypothesis-generating.
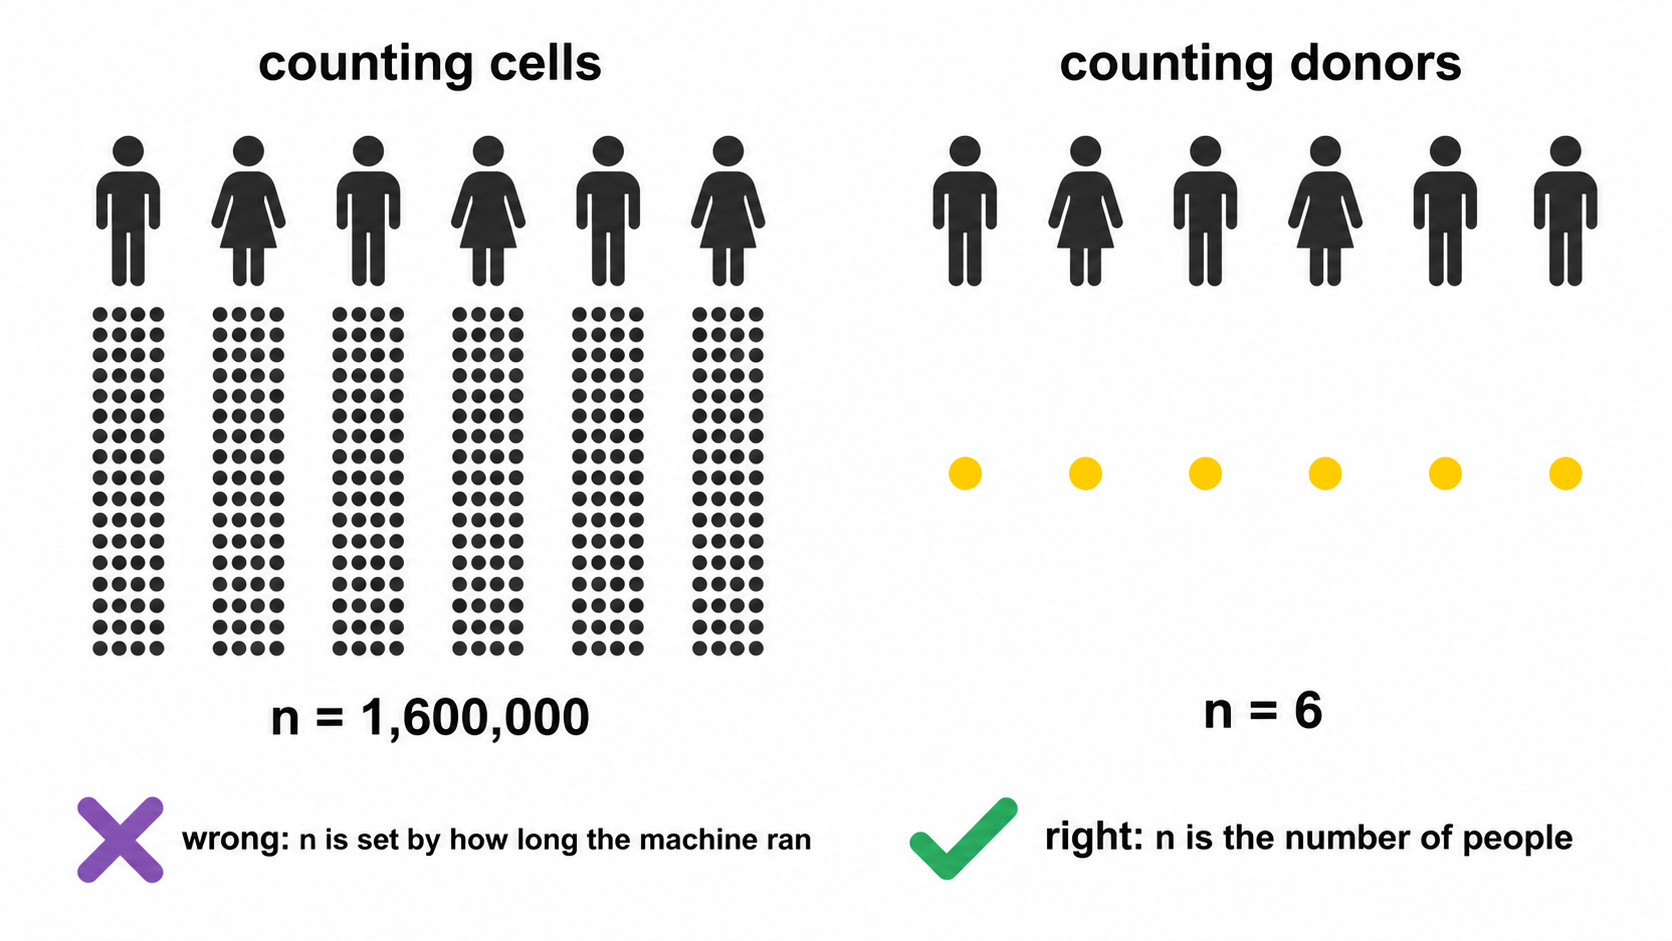
2. Test selection
Group comparisons use Wilcoxon rank-sum and Kruskal-Wallis, which assume independence and ordinal comparability.
The principal alternative, implemented in diffcyt, is limma’s moderated t, which stabilises variance estimates through an empirical Bayes prior shared across markers. At mass cytometry marker counts of 30 to 40 and designed sample sizes, this is the more powerful choice.
At a dozen markers and single-digit donors per group the prior is estimated from too few markers to stabilise, and the normality assumption becomes load-bearing at precisely the sample size where it cannot be assessed.
Cost. Reduced power under normality, and no direct mechanism for covariate adjustment.
Revisit at. Approximately fifteen samples per group, where the prior becomes informative and mixed models can accommodate repeated measures.
2a. The parametric tests, and why they are reported separately
Most immunology papers report a t-test or an ANOVA, and a reviewer may ask for one. Declining to compute it does not remove it from the paper; it moves the calculation somewhere with no record of whether its assumptions held.
So parametric_tests.csv carries the parametric
equivalent of every comparison, and
group_comparison_stats.csv is unchanged. Two files, two
answers, and the columns that decide between them sit on the parametric
row.
The transform. Frequencies are proportions. They are
bounded, their variance depends on their mean, and near 0 or 100 they
are strongly skewed, which is exactly where rare populations live. The
parametric tests therefore run on the empirical logit, log((p + e) / (1
− p + e)) with e the smallest non-zero proportion so that
0% and 100% stay finite. It is symmetric about 50% and stabilises the
variance near 0 and 100%, where the arcsine square root, the older
remedy, does not. Group means are reported back on the percentage scale,
because a difference in logits means nothing to a reader.
Which test. Two groups give Welch’s t-test, which does not assume equal variances, with Student’s t beside it. Three or more give Welch’s ANOVA with the classical one-way beside it. Welch’s is the default in both cases because equal variance is an assumption, not a property, and the cost of Welch’s when variances happen to be equal is small.
The assumptions, on every row.
brown_forsythe_p tests equal variance, using deviations
from the median rather than the mean so it does not itself assume
normality. shapiro_p tests normality of the
within-group residuals, not the pooled values, which
are bimodal whenever the groups differ and would fail the test for the
wrong reason. assumptions_met combines them and
recommended names the test to read.
Post-hoc. With three or more groups,
posthoc_tests.csv carries all three standard families:
Games-Howell, which uses Welch’s standard error and pair-specific
degrees of freedom and so pairs with Welch’s ANOVA; Tukey HSD, which
assumes equal variances and pairs with the classical ANOVA; and Dunn,
the rank equivalent that follows Kruskal-Wallis. All three are written,
adjusted within each family, and the assumption columns say which to
read. Choosing after seeing the p-values is the thing this arrangement
is designed to make visible.
What is still not here. Mixed models and GLMMs are
the right tool for repeated measures and are not implemented;
--paired-column with --condition-column covers
the two-timepoint case and nothing wider. Beta regression, which models
the bounded support directly rather than transforming it, is the better
answer at larger sample sizes. Both become worth the dependency at
roughly fifteen donors per group.
3. Compositionality
3.1 Constraint
Population percentages within a sample are constrained to sum to 100 and cannot vary independently. A genuine granulocyte expansion mechanically depresses every lymphocyte percentage. Those depressions test significant while absolute lymphocyte counts per microlitre remain unchanged.
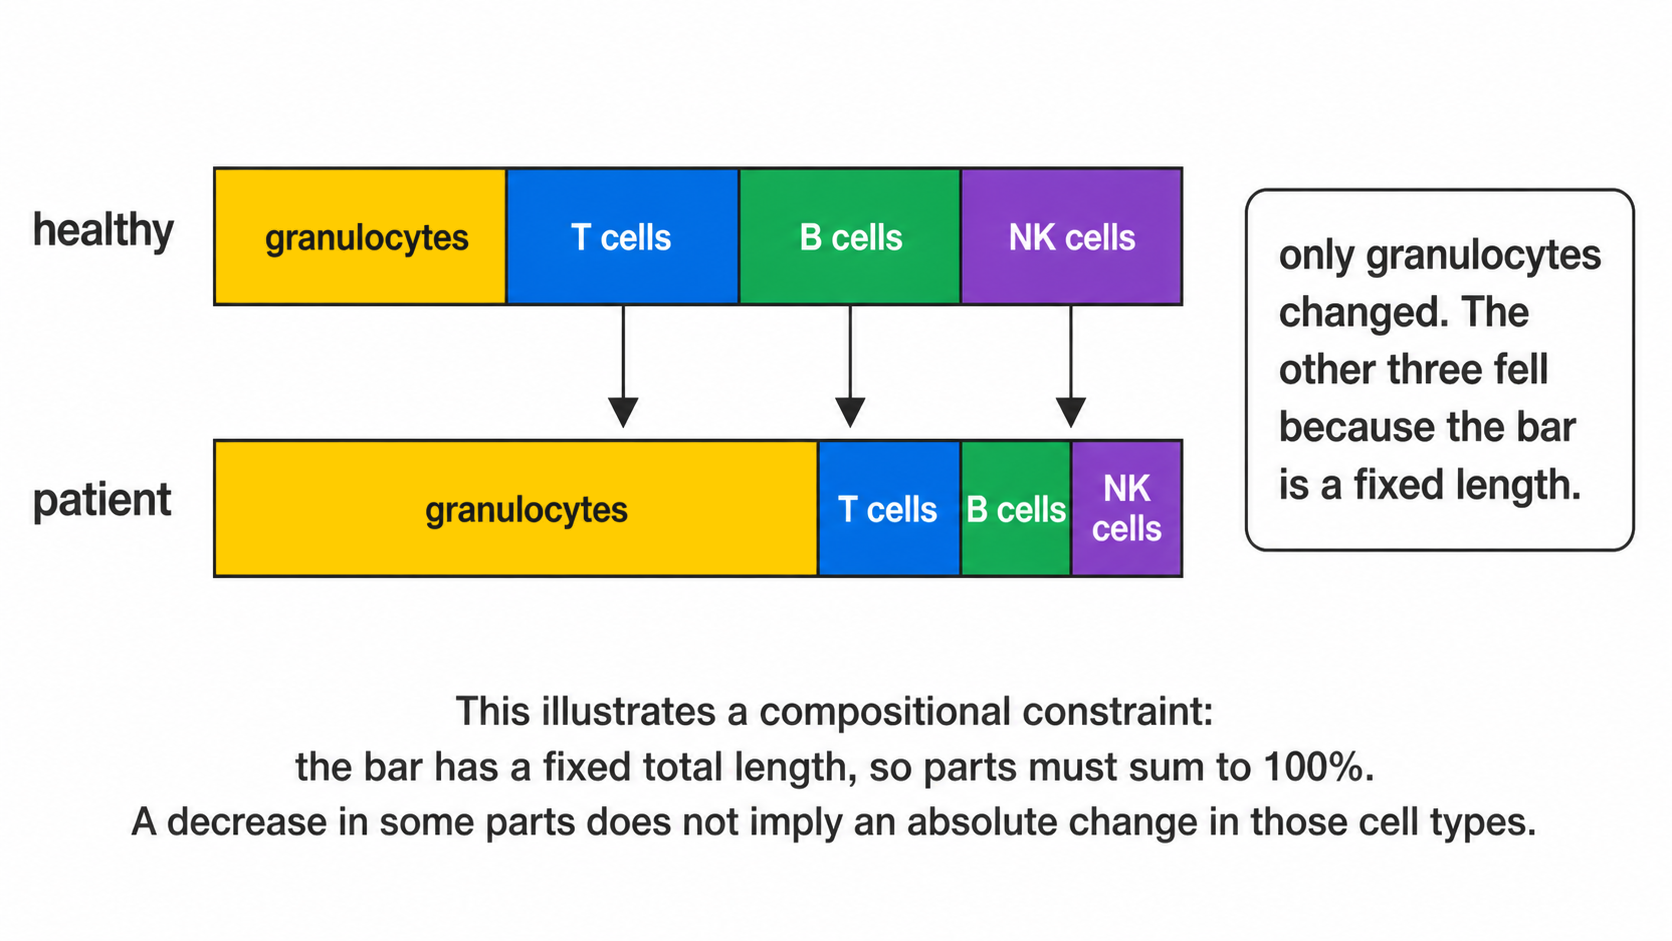
3.2 Log-ratio
clr_frequencies() applies the centred log-ratio,
expressing each population relative to the geometric mean of the sample
composition rather than to a fixed total.
share <- function() {
  v <- c(60, 25, 15) * exp(rnorm(3, 0, .1))
  100 * v / sum(v)
}
freq <- data.frame(
  sample_id = rep(sprintf("S%02d", 1:6),
                  each = 3),
  population = rep(c("Granulocytes",
                     "CD4 T cells",
                     "B cells"), 6),
  pct_of_cd45_pos =
    as.vector(replicate(6, share())),
  is_control = FALSE, qc_status = "pass")
cl <- clr_frequencies(freq)
head(cl[, c("sample_id", "population",
            "pct_of_cd45_pos", "clr")], 3)
#> sample_id population pct_of_cd45_pos
#> 1 S01 Granulocytes 61.69888
#> 2 S01 CD4 T cells 24.02756
#> 3 S01 B cells 14.27356
#> clr
#> 1 0.8023069
#> 2 -0.1407573
#> 3 -0.66154963.3 Concordance
Both parameterisations are tested and
compositional_concordance() classifies each result.
robust_to_composition survives both and supports
interpretation as an independent change.
raw_only__possible_composition_artefact is significant
on percentages and not on log-ratios, which is the configuration
produced by section 3.1.
clr_only__was_masked_by_composition is the converse, an
independent change obscured by the constraint.
3.4 Limit
The log-ratio does not recover absolute abundance. Proportional
expansion of every population leaves the composition invariant and is
undetectable in frequency data by construction. Discriminating expansion
from relative expansion requires cells per microlitre, so
abundance_measure() uses absolute counts wherever the
patient table supplies a leukocyte count.
4. Covariates
Age and sex are diagnosed rather than adjusted.
At the sample sizes cytometry cohorts reach, commonly under ten donors per group, a model estimating age and sex effects alongside the group term consumes the residual degrees of freedom required for the comparison of interest. Where the covariate is strongly associated with group, the parameters are not separable at any sample size, because the design contains no observations at the covariate levels required to estimate the effects independently.
stats_confounding() therefore reports the two conditions
that jointly define a confounder: differential distribution across
groups, and association with the outcome within groups (Rothman,
Greenland & Lash 2008), a partial Spearman correlation with group
held fixed. stats_rank_ancova() fits the adjusted model on
request, labels every row EXPLORATORY, and records
NOT FITTED with the reason where residual degrees of
freedom are insufficient.
4a. Clinical variables, which are a different question
A confounder is screened to decide whether a group difference can be
believed. A clinical variable, a severity score, a laboratory value, an
outcome flag, is the question itself, and
stats_clinical_association() treats it that way.
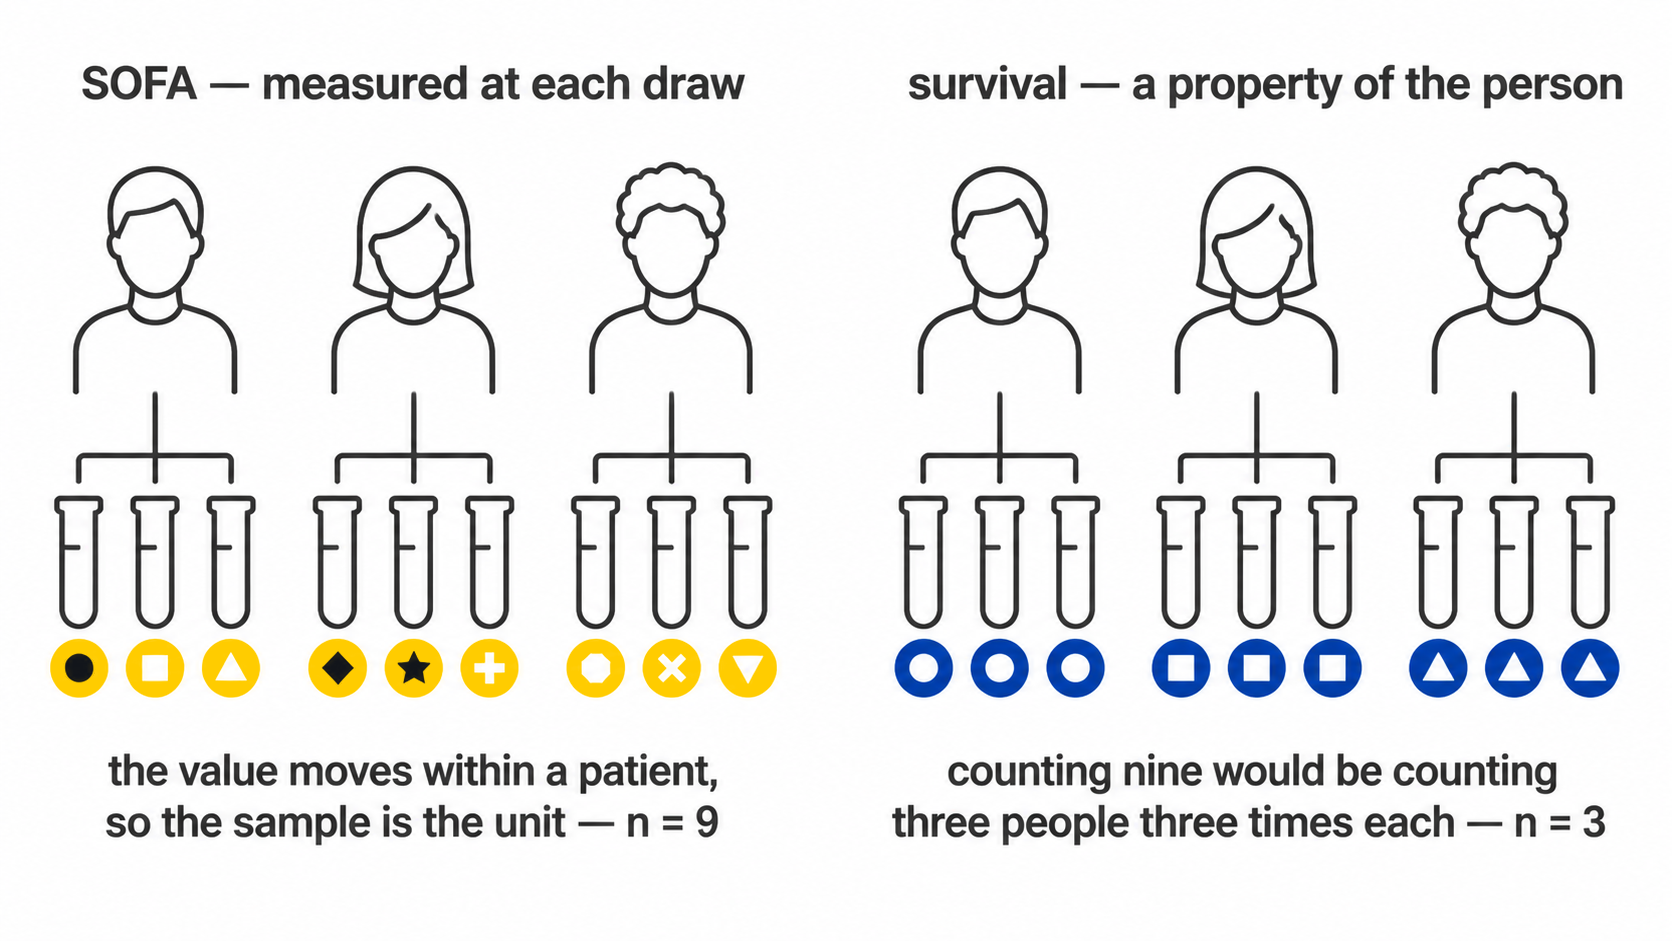
The test follows the variable’s type rather than being chosen:
| Variable | Test | Effect reported | Signed |
|---|---|---|---|
| Numeric (SOFA, CRP, lactate, BMI) | Spearman’s rho | rho, with a bootstrap interval | yes |
| Two levels (28-day survival) | Wilcoxon rank-sum | Cliff’s delta, with a bootstrap interval | yes |
| Three or more levels (infection focus) | Kruskal-Wallis | epsilon-squared | no |
Epsilon-squared is H / (n - 1), the proportion of rank
variance the grouping accounts for, bounded 0 to 1. It is unsigned,
because a variable with three unordered levels has a magnitude and no
direction, and that is carried explicitly in a signed
column rather than left for the reader to infer from a sign that happens
to be positive. Before it was added, a multi-level variable produced a
p-value and nothing else: the figure could say a test had run and not
whether it had found anything.
Rank methods throughout, for the reason they are used everywhere else in this package. Clinical scores are ordinal by construction, so a Pearson correlation asserts an interval scale the data does not have. Laboratory values are skewed and carry outliers that are real rather than erroneous, a creatinine of 335 is a patient, not a typing error, and a product-moment correlation on nine points with one such value is a statement about that one patient.
Multiplicity is corrected within each variable, across the populations tested against it. Each variable is one question asked of every population, and that is the family; pooling every variable into one correction would penalise a well-powered variable for the company it keeps. The choice is recorded here because it is a judgement rather than a default.
It also has a stated assumption, which is that the variables are
separate questions. They frequently are not: in a cohort where the
sickest patients are also the ones who died, SOFA and 28-day survival
describe one gradient, and a population associated with both is one
finding counted twice. fig_clinical_correlogram() exists to
make that visible before the heatmap is read, because no correction can
repair it and nothing else in the run would show it. Two-level variables
appear there coded 0/1, for which Spearman is the point-biserial
correlation of the ranks; variables with three or more unordered levels
are excluded rather than coded 1/2/3, which would invent an
ordering.
4b. Effect intervals on a small cohort
Every signed effect above is written with a 95% percentile bootstrap interval: 2000 resamples of the patient-value pairs for Spearman, stratified within each arm for Cliff’s delta, from a fixed seed so a given table always yields the same interval and the RNG stream is restored afterwards so nothing downstream is perturbed.
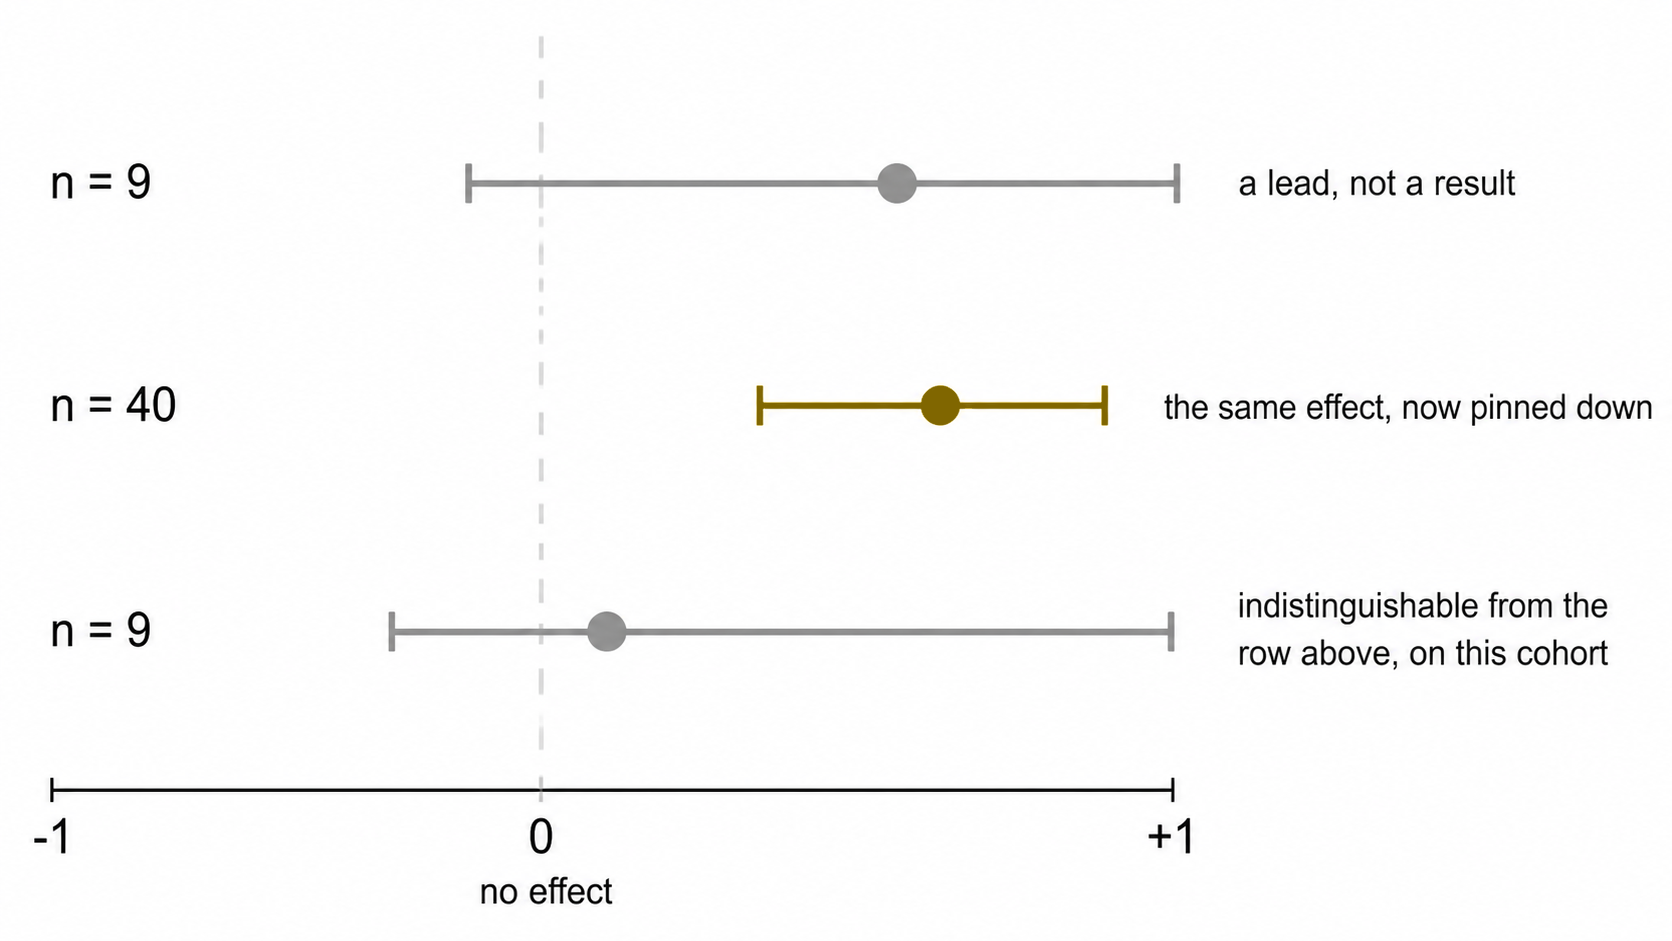
The interval is the part of the answer that carries how little a small cohort constrains the effect. On ten patients a rho of 0.61 with an interval from -0.1 to 0.9 and a rho of 0.05 can be the same underlying quantity, and the point estimate alone cannot say so; reporting the effect and its interval beside the p-value, rather than the p-value alone, is the standard recommendation for exactly this situation.
Its own limits are stated on the figure that draws it. A percentile bootstrap at this sample size is approximate: below about nine observations the effective resample is smaller than the nominal one and coverage falls short of 95%. So a wide interval should be read as this cohort does not constrain the effect rather than as a calibrated range, and no interval is written at all below six samples, a number quoted at a width nobody should trust is worse than a blank.
The same reasoning is why group_differences.png draws
the smallest p-value the design can reach. A Wilcoxon rank-sum test has
choose(n1 + n2, n1) equally likely rank arrangements under
the null, so the most extreme separation possible gives a two-sided p of
2 / choose(n1 + n2, n1). At 4 against 5 that is 0.016, and
after correcting across a dozen populations nothing can reach 0.05
however cleanly the groups separate. Where that floor sits above the
0.05 line, an empty region of the figure is a fact about the design and
not about the biology.
Two boundaries. This is association, not survival
analysis: a 28-day flag is tested as the two-group comparison
it is, and no time-to-event model is fitted, because the sample sheet
carries no follow-up time and a proportional-hazards fit on a binary
column with no time is a category error rather than an approximation.
And every test runs on one value per sample, so the
replicates are subjects; correlating a score against pooled events would
treat one deeply acquired patient as tens of thousands of independent
observations, which is the same failure abundance_measure()
exists to prevent.
The underpowered column marks every test run on fewer
than ten samples. At that size a rank test detects only very large
effects, so a null result carries almost no information and should not
be reported as evidence of no association.
5. Batch effects
Correction methods displace cells until batch labels mix. This is valid when batch is independent of the study design.
Clinical cohorts rarely satisfy that condition: recruitment and acquisition are typically sequential, so batch and group approach collinearity. Displacing cells until batches mix then also removes the biological contrast, and the algorithm cannot distinguish the two contributions.
batch_mixing_report() returns both required quantities
before any correction: iLISI against a permutation null, establishing
whether batch structure exists, and Cramér’s V, establishing
whether it is separable from group. A high V means no setting
makes correction safe, which is the most informative result the
diagnostic can return.
--correct-batch performs the correction and is refused
above a configurable threshold.
6. Multiplicity
Benjamini-Hochberg correction is applied within each test family, with raw and adjusted p-values both reported.
Differential state adjusts within each measure rather than across both. Median intensity and percent positive are two summaries of the same events and are strongly correlated; pooling them would inflate the family with non-independent hypotheses and over-penalise every result.
7. Effect sizes
Every p-value is reported with an effect size: Cliff’s delta across samples, or matched-pairs rank-biserial for paired designs. Clinical associations add a bootstrap interval on the effect as well; see §4b for why, and for why the interval is suppressed rather than narrowed below six samples.
Differences rather than ratios are reported for transformed intensities. Arcsinh and logicle scales admit negative values, on which a ratio is undefined in interpretation and changes sign without a corresponding change in biology.
8. Measurement resolution
An effect size states how large a difference is relative to the spread between donors. It does not state whether the instrument and the gating strategy could resolve a difference of that size at all.
difference_over_gate_u supplies the second quantity: the
observed difference in medians divided by the typical within-sample
uncertainty on the frequency, itself propagated from where the
thresholds were placed. Below one, the groups differ by less than the
distance the cut travels under resampling of the cells that determined
it.
This is a screen, not a test. The uncertainty is partly shared across
the run, since every sample passes through one panel, one transform and
one placement rule, so it cancels in part when a difference is taken and
the ratio is conservative. A ratio below one is a reason to open
threshold_uncertainty.csv before interpreting the
comparison, not grounds to discard it.
difference_over_total_u repeats the comparison against
the gate term and the counting term together. The two ratios coincide
for an abundant population and separate for a rare one, where the
threshold can be well placed and the frequency still rest on too few
events to support the difference being tested. Where they disagree, the
smaller is the one to act on.
The order to read remains: adjusted p, then effect size, then these. A result that survives all of them is one where the groups differ, the difference is large relative to donor variation, and it is larger than both the distance the gate can move and the noise in the count.
8a. Detection limits
An effect size and a p-value can both be computed from a population of nine events. Neither reports that fact.
detection in population_frequencies.csv
classifies each value against the conventional limits of detection and
quantification, twenty and fifty events against the parent gate. A
population below the limit of quantification in most samples should not
be carried into a group comparison at all: the test will run, and its
result is a statement about acquisition depth.
This is a screen on the measurement rather than a correction to the test. No p-value is adjusted by it, and the tests behave as they did before.
9. Summary
| Question | Function | Unit |
|---|---|---|
| Did population abundance change? | stats_group_comparison() |
sample |
| Does it survive the compositional constraint? |
clr_frequencies(),
compositional_concordance()
|
sample |
| Did marker expression change within a population? | stats_marker_state() |
sample |
| Is the contrast confounded by age or sex? | stats_confounding() |
sample |
| Is the contrast confounded by batch? | batch_mixing_report() |
cell, descriptive |
| Is the contrast an artefact of the gate? |
stats_threshold_drift(),
cluster_gate_agreement()
|
sample and cell |
| Is the difference bigger than the gate’s own uncertainty? |
run_gate_uncertainty(),
annotate_gate_uncertainty()
|
sample |
| Were enough cells counted for the frequency to mean anything? | counting_uncertainty() |
sample |
| Which markers shift within a subcluster? | stats_subcluster_shifts() |
cell, no p-value |
10. Sources for the tests implemented here
Where each method came from, and what it is for.
Proportions. Population frequencies are bounded and their variance depends on their mean, so a test assuming constant variance is wrong in a way that gets worse as the population gets rarer. The logit is used here: Warton and Hui (2011, Ecology 92:3) argue the arcsine square root should not be used for proportions, and for flow cytometry results the logit gives symmetric distributions and homogeneous variances near 0 and 100% (Seiffert et al. 2024, Front Mol Biosci 11:1335174).
Unequal variance. Welch’s t-test and Welch’s ANOVA do not assume equal variances, so they stay valid when group sizes and spreads differ, which they almost always do in an immunophenotyping cohort. Games-Howell is the post-hoc test that matches: it uses Welch’s standard error and pair-specific degrees of freedom rather than one pooled estimate (rstatix).
Rank post-hoc. Dunn’s test compares mean ranks computed over the whole dataset, which is what makes it the correct follow-up to Kruskal-Wallis. A set of pairwise Wilcoxon tests re-ranks within each pair and answers a different question.
Clinical associations: the unit of analysis. A
cohort sampled at several timepoints carries two kinds of clinical
column. One is constant within a patient , 28-day survival, BMI, age,
and asks a between-subject question; the other varies within a
patient, a severity score at each draw, and asks a
within-subject one. Treating repeated samples from one patient
as independent observations is pseudoreplication: it inflates the
apparent sample size, narrows the interval and makes significance more
likely without a single extra patient having been recruited, and it is
common enough in the life sciences to be one of the standard threats to
reproducibility (The
problem of pseudoreplication in neuroscientific studies, BMC
Neuroscience; Statistics
Done Wrong, on pseudoreplication). Collapsing to one value per
subject is the first remedy named in that literature and is what
clin_variable_unit() triggers for a patient-constant
column.
For a column that varies within a patient, collapsing would delete
the variation being asked about, so the per-sample test is kept and
n_patients and repeated_measures are reported
beside it. The dedicated method there is a repeated-measures
correlation, which estimates the common within-individual slope without
averaging (Bland
& Altman 1995; Bakdash & Marusich, Frontiers in
Psychology 2017, implemented in rmcorr).
It is named rather than implemented, for the same reason as the mixed
models below.
Effect sizes with intervals, not p-values alone.
Reporting the estimated effect with a confidence interval, rather than a
p-value on its own, is what the reporting guidelines for prognostic
marker studies ask for, and the surveys behind those guidelines found
96% of papers reporting p-values against 42% reporting an interval (REMARK
explanation and elaboration, BMC Medicine 2012).
clinical_association.csv carries ci_low and
ci_high on every signed effect for that reason, and
fig_clinical_forest() draws them.
Rank effect sizes. Cliff’s delta is the
non-parametric two-group effect size for ordinal or non-normal data, and
percentile bootstrap intervals are the standard way to bound it (Cliff’s
Delta Calculator, Universitas Psychologica). Epsilon-squared,
H / (n - 1), is the corresponding effect size for
Kruskal-Wallis, following Tomczak & Tomczak’s recommendation as
implemented in rstatix::kruskal_effsize();
it is unsigned because a variable with three unordered levels has no
direction. The bootstrap’s own limit at these sample sizes, an effective
resample smaller than the nominal one, and coverage falling short of 95%
below about nine observations, is documented rather than ignored (Statistical
uncertainty analysis for small-sample, high log-variance data),
which is why no interval is written below six.
What is not implemented. Generalised linear mixed
models are the right tool when donors contribute several samples, and
CytoGLMM implements them for cytometry specifically (Seiler et al.).
Beta regression models bounded support directly instead of transforming
it (npj
Systems Biology, 2025). Both need more donors per group than the
cohorts this package is aimed at, and both add a dependency whose
failure modes are harder to explain than the tests above.
--paired-column with --condition-column covers
the two-timepoint case; anything wider belongs in one of those
packages.
Using cyRAVEN with cyCONDOR
cyRAVEN applies a declared specification and tests whether it held. cyCONDOR clusters events and assigns identity afterwards. The two approaches carry non-overlapping failure modes, which makes combined application informative for a substantial class of study designs.
1. Rationale
Supervised quantification is bounded by its specification. A population absent from the declaration cannot be recovered, because no gate exists to fail.
Unsupervised partitioning carries the complementary limitation. It returns clusters for any input and holds no prior claim capable of being contradicted, so it cannot identify a mis-specified threshold. Its own parameters, cluster count, feature set and transform, are selected after inspecting the data, which relocates analyst discretion rather than removing it.
Applied together, each constrains the other. The principle is established: DAFi converts a manual gating strategy into constraints on a recursive clustering and recovers rare populations that neither approach resolves independently (Lee et al., 2018).
2. Selection
| Objective | Tool | Basis |
|---|---|---|
| Abundance of a declared population between groups | cyRAVEN | Populations defined a priori, donor-level inference |
| Verification that gates transferred across samples | cyRAVEN | Threshold drift, phenotype concordance, gate-cluster concordance |
| Detection of an undeclared population | Both | cyRAVEN identifies the discordance, cyCONDOR characterises the population |
| Conversion of a cluster into executable gate geometry | cyRAVEN |
--explain-clusters, or --external-labels
for a labelling cyCONDOR produced |
| Whether that gate works on the next donor | cyRAVEN | Leave-one-donor-out refitting |
| A gate file the instrument or Cytobank can read | cyRAVEN |
--export-gates, Gating-ML 2.0 in linear units |
| How precisely a reported frequency is determined | cyRAVEN | Threshold resampling propagated to the population |
| Differentiation trajectory | cyCONDOR | Diffusion maps and Slingshot |
| Label transfer to an independent cohort | cyCONDOR | Trained classifiers |
| Ingestion of existing FlowJo gates | cyCONDOR |
.wsp workspace parsing |
| Data-determined cluster count | cyCONDOR | Phenograph |
| Unsupervised discovery without leaving cyRAVEN | cyRAVEN |
--explore, over every eligible channel, with clusters
named from per-sample thresholds. See Explore
mode
|
| Whether batch correction is admissible | cyRAVEN | Cramér’s V refusal rule |
3. Applications
3.1 Abundance change
A declared population differs in frequency between groups. Four outputs determine whether the difference is interpretable, read in order.
threshold_drift_stats.csv. A flagged marker means the
per-sample thresholds separate by group, so the population is not
identically defined across the comparison and the difference is partly
definitional.
compositional_concordance.csv. Percentages are
constrained to sum to 100. A result classified
raw_only__possible_composition_artefact is consistent with
expansion elsewhere in the composition rather than change in the
population tested.
cluster_gate_agreement_populations.csv. A declared
population distributed across several clusters is phenotypically
heterogeneous, and the aggregate frequency averages subsets that may
respond in opposite directions.
confounding_diagnostics.csv. Whether a covariate both
differs between groups and associates with the outcome.
cyCONDOR contributes nothing here unless the third output indicates heterogeneity, in which case the constituent subsets require characterisation.
3.2 Undeclared population
Order matters in this analysis.
Run cyRAVEN with --cluster --explain-clusters.
Gate-cluster concordance identifies a cluster dominated by the
unassigned label, which establishes that the specification is
incomplete. cluster_gate_proposals.csv returns two-marker
gate geometry selecting those events, with performance measured on
held-out cells, which is sufficient to reproduce the gate at the
instrument.
Characterise in cyCONDOR. plot_marker_ridgeplot,
plot_marker_violinplot and plot_marker_dotplot
resolve the full intensity distribution rather than a median, and
plot_marker_group_HM compares it across groups. Where the
population may occupy a differentiation axis, runDM and
runPseudotime establish whether a trajectory is
supported.
Return to cyRAVEN. Add the population to the
populations: block using the markers the proposal
identified and re-run. It now carries a per-sample frequency and a
donor-level test.
The final step is not optional. A population identified by clustering and tested by clustering on the same events was selected because it separated in those samples. Once declared, it is tested honestly in the next cohort.
3.3 A cyCONDOR cluster made executable
The reverse direction, and the one that closes the loop. cyCONDOR finds a population; the finding lives in a vector of cluster assignments and cannot be sorted on, drawn at the instrument, or applied to next year’s files without clustering them again.
Export the assignment with the sample and the event index, then hand it over.
fs <- condor@clustering$FlowSOM
meta <- fs$metacluster
cl <- data.frame(
  sample  = condor@anno$sample_id,
  event   = condor@anno$event_index,
  cluster = paste0("k", meta))
write.csv(cl, "labels.csv",
row.names = FALSE)cyRAVEN fits a sequence of two-marker polygon gates to each label,
then refits the whole sequence with one donor withheld and scores it on
that donor, once per donor.
gate_transferability_summary.csv carries the spread of
those scores. Read f1_min: a gate that works on nine donors
and fails on the tenth has the same median as one that works on all
ten.
--export-gates writes the surviving strategy as
Gating-ML 2.0 in the linear units the FCS file stores, which Cytobank
and FlowRepository read directly and FlowJo reads through an ACS
archive.
The join is on sample and event index, never row position. cyCONDOR
subsamples at prep_fcd(max_cell = ) and cyRAVEN takes its
own cap for the embedding, so the two tables are not row-aligned and a
positional join would relabel every cell without raising anything.
Hypergate established cluster-to-gate conversion, fitting one hyperrectangle per cluster (Becht et al., 2018). What is added here is the polygon hierarchy, which is the shape a sorter is actually driven in, the per-donor score distribution, and the gate file.
3.4 Multi-site or longitudinal designs
Analyst variance is the limiting factor. Thirty-eight operators gating the same files carried a median expanded uncertainty of 3.6% under a gauge repeatability and reproducibility design (Grant et al., 2021), and across 320 routine clinical samples the residual dispersion was structured primarily by operator identity rather than by instrument configuration (Mead et al., 2026). Reagent standardisation alone is insufficient: EuroFlow reached between-centre coefficients of variation below 7% only after standardising the analysis (Kalina et al., 2012).
Use cyRAVEN as the primary analysis. A declared specification with
per-sample thresholds removes the analyst from the step at which that
variance enters. Version-control the config alongside the results and
retain run_manifest.txt.
Write a baseline from the first accepted run and pass
--baseline on every later one. The within-run threshold
check compares each sample against its peers, which finds a bad tube and
cannot find a site or a season that moved as a whole, since the peer
median moves with it. On a scheduled pipeline,
--fail-on-drift makes the verdict an exit code.
Use cyCONDOR as a periodic audit. Cluster the accumulated data without reference to the specification and confirm that reported populations still resolve as coherent clusters. Populations that begin to split or merge indicate acquisition drift requiring the specification to be revisited.
4. Execution
Both tools read the same FCS files. cyCONDOR requires an annotation table whose first column names the files, which is the information a cyRAVEN sample map already carries, so one file serves both.
run_cyraven(list(
  dir = "data/fcs/",
  outdir = "results_cyraven/",
  sample_map = "data/sample_map.csv",
  config = "data/panel.yaml",
  group_column = "cohort",
  reference_group = "Healthy controls",
  unsupervised = TRUE,
  explain_clusters = TRUE
))

anno <- read.csv("data/sample_map.csv")
at <- "results_condor/anno_table.csv"
write.csv(anno, at, row.names = FALSE)

condor <- cyCONDOR::prep_fcd(
  data_path = "data/fcs/",
  max_cell = 30000, useCSV = FALSE,
  transformation = "auto_logi",
  remove_param = c("Time", "InFile"),
  anno_table = at,
  filename_col = "file", seed = 42)
condor <- cyCONDOR::runPCA(
  condor, data_slot = "orig", seed = 42)
condor <- cyCONDOR::runUMAP(
  condor, input_type = "pca",
  data_slot = "orig", seed = 42)
condor <- cyCONDOR::runFlowSOM(
  condor, input_type = "pca",
  data_slot = "orig",
  nClusters = 8, seed = 42)
The benchmark/ directory of the cyRAVEN repository
executes both on a public dataset and writes the comparison.
5. Embeddings
The two UMAPs are not comparable, for four reasons measured on the benchmark dataset and given in order of magnitude.
Event set. cyCONDOR embeds all 235,259 events. cyRAVEN embeds 40,000 events surviving scatter, singlet, viability and CD45 gating. A fraction of the cyCONDOR manifold is debris.
Feature set. cyCONDOR includes FSC-A, FSC-H, FSC-W and SSC-A among eleven features. Scatter spans decades and dominates the principal components on which the embedding is computed, so much of the resulting structure reflects size and granularity. cyRAVEN uses scatter for gating and excludes it from the feature set, embedding four markers.
Input space. cyCONDOR embeds principal component scores; cyRAVEN embeds the scaled marker matrix, which alters the neighbour graph before construction.
Transform. Auto-logicle per file against arcsinh pooled per panel places identical raw intensities at different coordinates.
Compare the tables, not the figures.
6. Resolution
Cluster count is an analytical choice with consequences. On the benchmark data FlowSOM requested at 8 returns 8 clusters; Phenograph, which determines its own, returns 24 on the same events. Both are correct implementations. Neither corresponds to the number of populations present.
A result that appears at one resolution and disappears at another is a property of the setting. Confirm persistence across resolutions before interpretation.
FlowSOM is a defensible default: it ranked at or near the top across every dataset in the reference comparison of clustering methods, at runtimes permitting routine use as a cross-check (Weber and Robinson, 2016).
7. References
- Lee et al., 2018. DAFi: gating strategy as constraint on recursive clustering. Cytometry A.
- Briefings in Bioinformatics, 2025. Systematic comparison of manual gating, unsupervised clustering and auto-gating across 23 tools.
- Weber and Robinson, 2016. Clustering method comparison. Cytometry A 89:1084.
- Kalina et al., 2012. EuroFlow standardisation. Leukemia 26:1986.
- Grant et al., 2021. Operator subjectivity as measurement uncertainty: 38 participants, median expanded uncertainty 3.6%. PDA J Pharm Sci Technol 75:33.
- Mead et al., 2026. Interpretive contribution to analytical variability, 320 clinical samples and six technologists. Cytometry B Clin Cytom.
- Becht et al., 2018. Hypergate: reverse-engineering a gating strategy from a cluster. Bioinformatics 35:301.
- Spidlen et al., 2015. ISAC Gating-ML 2.0. Cytometry A 87:683.
- Grant et al., 2021. Uncertainty analysis applied to manual gating; a diagrammatical protocol cut between-participant variation by 57%. Methods Protoc 4:24.
Driving it from Claude Code
The repository ships a skill for Claude Code at
.claude/skills/cyraven/. Installed, it gives the assistant
the parts of this documentation that determine whether an answer is
correct: Docker as the execution path, the gate hierarchy and
specification syntax, and the order in which the outputs must be
read.
It is documentation, not a wrapper. Nothing about the pipeline changes, and every command works without it.
The skill executes through Docker by default and does not fall back to a local R installation unless the user states that Docker is unavailable, for the reproducibility reasons given in the README.
1. What it covers
| File | Content |
|---|---|
SKILL.md |
What cyRAVEN does, the Docker execution commands, required inputs, the flags that matter, and the analytical constraints in section 4 |
references/docker.md |
Build and run in detail, path and mount semantics, Windows and
PowerShell, resource tuning, iterating with CYRAVEN_SOURCE,
container-specific failures |
references/gating.md |
The four-gate hierarchy, per-sample thresholding and the
source column, writing the population YAML, three-level
markers, arcsinh against logicle, compensation |
references/interpretation.md |
Every output file and the order to read them in, with the columns that decide whether a result stands |
references/troubleshooting.md |
Failure modes with their actual causes |
Only SKILL.md is read when the skill activates. The
reference files are opened when the task needs them, so the description
above is also the routing table.
2. Installing
For every project
Copy the directory into the personal skills folder:
Confirm with /skills, or ask Claude to invoke
/cyraven.
For this repository only
Nothing to do. A checkout already contains
.claude/skills/cyraven/, and Claude Code discovers it when
the session is rooted in the repository.
Without a copy
Point Claude at the raw SKILL.md by pasting its link with:
Read this SKILL.md and follow it:
<paste the link here>
3. Using it
The skill activates on its own when a request matches its
description. Force it with /cyraven.
Requests it is built for:
Run cyRAVEN on the FCS files in ./data.
The panel is CD3, CD4, CD8, CD14, CD16,
CD19, CD56, HLA-DR.

Set up the demonstration dataset and
show me what the output looks like.

Write a population spec for this panel
and explain each definition.

My frequency table came out empty. Why?

Read results/ and tell me which findings
survive.

Is the difference in CD8 T cells between
the two cohorts real?
The first builds and invokes the container without being asked to, because that is the skill’s default execution path.
The last is the case worth having the skill for. It has a documented
answer that is not a p-value: adjusted p, then Cliff’s delta, then
difference_over_gate_u, then
difference_over_total_u, then a check that the marker is
not flagged in threshold_drift_stats.csv. The order is set
out in Statistics §8, and the
skill states it so the assistant does not stop at the first significant
result.
4. Analytical constraints
The skill carries five positions the tool takes. They are recorded because overriding any of them produces output that appears correct and is not. Each is documented at length elsewhere and summarised there only to the extent needed to apply it.
| Constraint | Treated in full |
|---|---|
| Thresholds are not transferred between samples | Gating §2.1 |
count is an event count, not a cell number |
Output §4 |
| Placement precision does not imply counting sufficiency | Gating §2.5 |
| A specification is a hypothesis, not a validated result | Diagnostics |
| Gates are inspected before any derived number is quoted | Diagnostics §1 |
5. Contributing through it
SKILL.md also carries the conventions this package is
maintained under, so a change proposed with the skill loaded arrives in
the right shape:
- Additions are additive. Every file the previous version wrote is still written, with the same name, the same columns in the same order, and the same values.
- Additivity is verified by running both versions on one cohort and comparing byte for byte, not by asserting it.
- Anything that only adds an output is on by default. Anything that changes an existing number is opt-in.
- Any new entry point that consumes random draws saves and restores
.Random.seed.run_cyraven()seeds once and the UMAP cell selection draws from that stream, so a step that spends draws silently redraws every embedding in the run.
6. Keeping it accurate
The skill quotes flag defaults, output filenames and column names. Those were checked against the source when it was written and will drift if the package changes without it.
When adding a flag or an output, update SKILL.md and the
reference file that mentions the area. The filenames are verifiable
mechanically:
Cross-check that list against
references/interpretation.md.